
Analytics, Baltic, Demography, Latvia, Society
International Internet Magazine. Baltic States news & analytics
Saturday, 20.04.2024, 14:08
In 2017, usually resident population of Latvia declined by 15.7 thousand
 Print version
In 2017, the number of deaths exceeded the number of births by 7.9 thousand, being the highest indicator recorded over the past four years (6.6 thousand in 2016). Last year, 20.8 thousand children were born (1 140 children fewer than in 2016), whereas 28.7 thousand people passed away (177 more than in 2016).
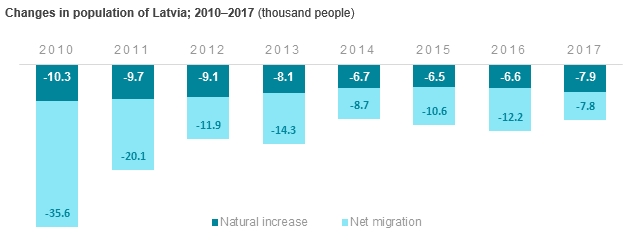
As a result of international long-term migration, population fell by 7.8 thousand in 2017 (12.2 thousand in 2016). Last year, 9.9 thousand people arrived in Latvia from other countries (1.6 thousand more than in 2016), while 17.7 thousand left the country (2.9 thousand fewer than in 2016). Approximately half (55%) of immigrants are related to Latvia (e.g., born here, etc.).
Demography trends in Latvia; 2015–2017
|
|
2015 |
2016 |
2017 |
2016,
compared to 2015,% |
2017,
compared to 2016,% |
per
1 000 inhabitants |
|
|
2016 |
2017 |
||||||
|
Population, at the end of the year |
1 968 957 |
1 950 116 |
1 934 379 |
-1.0 |
-0.8 |
x |
x |
|
Marriages |
13 617 |
13 002 |
13 150 |
-4.5 |
+1.1 |
6.6 |
6.8 |
|
Divorces |
5 151 |
6 061 |
5 943 |
+17.7 |
-1.9 |
3.1 |
3.1 |
|
Births |
21 979 |
21 968 |
20 828 |
-0.05 |
-5.2 |
11.2 |
10.7 |
|
Deaths |
28 478 |
28 580 |
28 757 |
+0.4 |
+0.6 |
14.6 |
14.8 |
|
Immigration |
9 479 |
8 345 |
9 916 |
-12.0 |
+18.8 |
4.3 |
5.0 |
|
Emigration |
20 119 |
20 574 |
17 724 |
+2.3 |
-13.9 |
10.5 |
9.1 |
Net migration is lower than net natural increase for the first time since 2007, indicating to lower emigration.
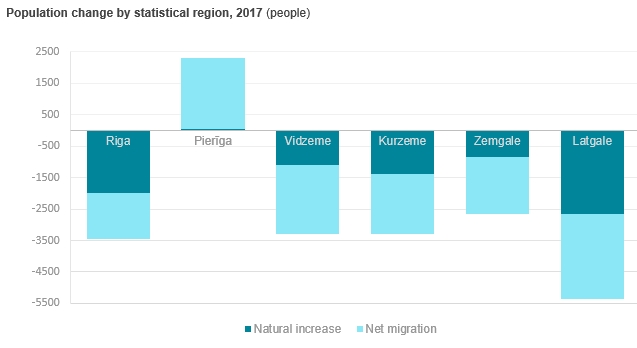
Population of Pierīga is growing
In regional breakdown, population increase was recorded only in Pierīga – of 2.3 thousand or 0.6%. Internal migration is the key factor influencing this growth, however natural increase in Pierīga has been positive already for three years in a row.
The most notable population decline is still registered in Latgale region – of 5.4 thousand people or 2.0%, which is 0.3 percentage points less than in 2016. Vidzeme population reduced by 3.3 thousand (1.7%), as did the population of Kurzeme (by 3.3 thousand or 1.3%), Zemgale (2.7 thousand or 1.1%), and Riga (3.5 thousand or 0.5%). One third of the total population live in Riga.
Population decline was registered in seven out of nine cities under state jurisdiction. In 2017, positive population change was observed only in Jūrmala (rise of 1.0% or 467 people) and Valmiera (0.4% or 102 people). The most notable population decline was recorded in Ventspils (of 1.4% or 507 people), Daugavpils (1.6% or 1342), Jēkabpils (1.0% or 224), while the smallest in Rēzekne (of 0.1% or 18 people).
Last year, out of 110 counties population rise was recorded in 15. The most significant increase was registered in Pierīga counties, however upturn was observed also in Brocēni and Ozolinieki. Just like in counties located in Pierīga, Ozolnieki had growth in both internal migration and birth number. Population in Brocēni is influenced by the rise in internal migration that is due to the development of new residential house projects facilitating emigration from Saldus. The most notable population increase was recorded in Mārupe county (of 935 people or 5.0%), while the lowest in Sigulda county (of 79 people or 0.5%). All 15 counties had positive net migration, whereas positive natural increase was recorded in 9 counties.
Slight increase in number of children
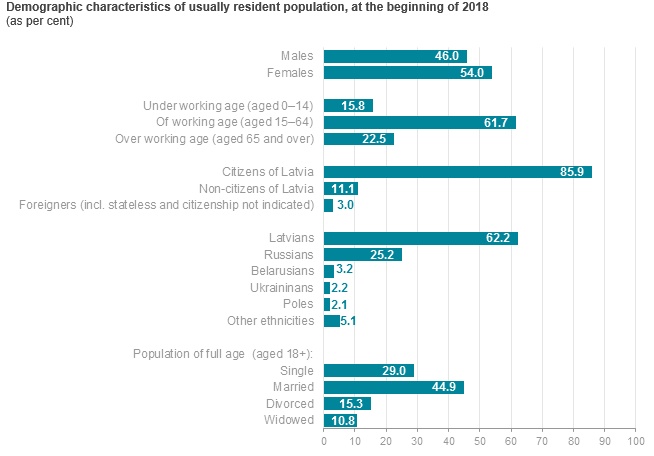
Resulting from the small birth rise, number of children aged 0–14 grew by 13.0 thousand over the past five years (by 1.7 thousand in 2017), constituting 15.8% of the total population at the beginning of 2018 (14.4% at the beginning of 2013). The highest share of children was recorded in Pierīga region – 18.1% of the total population of the region, while the smallest in Latgale region – 13.7%.
In 2017, population in the age group 15–64 kept declining – by 18.4 thousand or 1.5%. The largest share of population at working age was recorded in Latgale (64.7%), while the smallest in Kurzeme (63.2%).
Population aged 65 and over kept growing – by 0.9 thousand in 2017. Its share in the total population rose from 19.9% at the beginning of 2017 to 20.1% at the beginning of 2018. In all regions, population aged 65 and over accounts for approximately one fifth (largest in Latgale – 21.6%, smallest in Pierīga – 18.1%).
In 2017, population decline was recorded among all largest ethnicities: number of Belarussians fell by 2.4%, of Poles by 2.2%, of Lithuanians and Romanies by 2.1%, and of Russians by 1.7%. Number of Latvians dropped by 0.8%, however their share in the total population keeps growing, regardless the decline in the absolute number. Last year, the share of Latvians in the total population of the country rose from 62.0% at the beginning of 2017 to 62.2% at the beginning of 2018.
The highest share of Latvians was recorded in Vidzeme (87.2%) and Kurzeme (76.7%) regions, while the smallest in Latgale (45.9%) and Riga (47.0%).
In respect to the citizenship, 85.9% of people are citizens of Latvia (85.7% in 2016), 11.1% are non-citizens of Latvia (11.4%) and 2.2% are citizens of Russia (2.2%). Out of all non-citizens, 51% live in Riga, constituting 17% of the total.
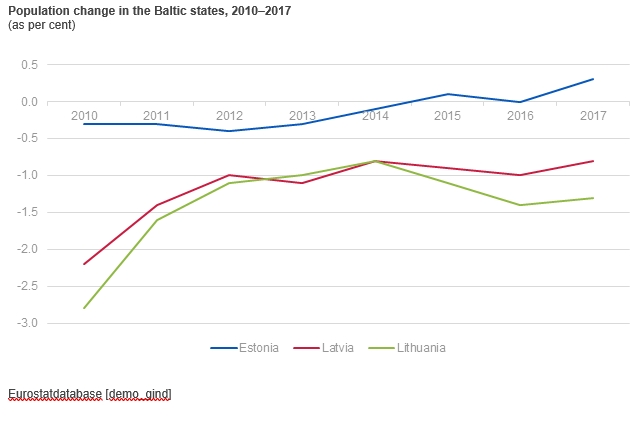
Population of Estonia is growing, while that of Lithuania declining
At the beginning of 2018, population of Estonia1 accounted for 1 million 319 thousand (3.5 thousand more than in 2017). Natural increase in Estonia was negative as well – 1.7 thousand (13.8 thousand people were born and 15.5 thousand people died in Estonia in 2017), while international long-term net migration was positive – 5.2 thousand (17.6 thousand people immigrated and 12.4 thousand emigrated).
Provisional population of Lithuania accounted for 2 million 809 thousand at the beginning of 2018 (drop of 39.0 thousand people). Lithuanian natural increase – 11.4 thousand (28.7 thousand births and 40.1 thousand deaths in 2017) and net migration – 27.6 thousand, were negative as well.
Information on population of administrative territories at the beginning of 2018 as well as the key demographic indicators are available in the CSB database section Population and Social Processes.
Methodological explanations
Natural increase– the difference between the number of births and the number of deaths in a given period.
Net migration– difference between the total number of persons arriving in the country for permanent residence for at least one year and total number of persons departing from it for permanent residence or for at least one year.
Usually resident population in the main age groups is calculated based on the age in full years in line with the working and retirement age set by the Latvian legislation. At the beginning of 2018, working age constituted 15–62 years (incl.) and retirement age – 63 years and over.
1Estonia statistics website https://www.stat.ee/news-release-2018-050


 «The Baltic Course» Is Sold and Stays in Business!
