
Analytics, Industry, Lithuania, Markets and Companies
International Internet Magazine. Baltic States news & analytics
Friday, 19.04.2024, 23:01
In April, industrial production decreased by 7.8% in Lithuania
 Print version
Over the month, seasonally and calendar adjusted, a decrease in production was observed for the manufacture of basic pharmaceutical products and pharmaceutical preparations – 68.8% (unadjusted – 70.9%), refined petroleum products – 39% (unadjusted – 36.3%), other transport equipment – 8% (unadjusted – 14.3%), electrical equipment – 4.8% (unadjusted – 14.3%), textiles – 3% (unadjusted – 8.9%), food products – 1.6% (unadjusted – 10.4%).
Table 1. Changes in industrial production, at constant prices of 2015, growth, drop, (−), %
|
Economic activities |
April 2018, against |
|||
|
March 2018,
seasonally and calendar adjusted |
March 2018 |
April 2017, calendar adjusted |
April 2017 |
|
|
Industry (B–E) |
−7.8 |
−16.0 |
3.0 |
3.8 |
|
Mining and quarrying, manufacturing (B and C) |
−7.1 |
−12.9 |
4.5 |
5.6 |
|
Mining
and quarrying (B) |
−1.4 |
20.4 |
−17.3 |
−12.5 |
|
Manufacturing (C) |
−7.2 |
−13.1 |
4.9 |
5.9 |
|
Manufacturing (except for the manufacture
of refined petroleum products) (C excl. C19) |
−0.2 |
−8.5 |
10.1 |
12.4 |
|
Electricity, gas, steam and air conditioning supply (D) |
−15.1 |
−41.1 |
−13.1 |
−13.2 |
|
Water supply, sewerage, waste management and
remediation activities (only Division 36 of Section E – water collection,
treatment and supply) |
0.8 |
2.5 |
5.0 |
5.9 |
|
Main industrial groupings |
|
|
|
|
|
Energy products |
−21.2 |
−37.8 |
−18.4 |
−20.3 |
|
Intermediate goods |
1.5 |
−4.9 |
13.8 |
16.1 |
|
Capital goods |
−0.9 |
−8.6 |
19.8 |
19.1 |
|
Consumer durables |
3.2 |
−7.9 |
9.3 |
10.6 |
|
Consumer non-durables |
0.2 |
−13.8 |
3.8 |
2.3 |
In January–April 2018, industrial production totalled EUR 6.9 at current prices, and against the same period of 2017, calendar adjusted and unadjusted, increased by 5.6% at constant prices.
Table 2. Changes in industrial production, at constant prices of 2015, growth, drop, (−),%
|
Economic activities |
January–April 2018, against |
|
|
January–April 2017, calendar adjusted |
January–April 2017 |
|
|
Industry (B–E) |
5.6 |
5.6 |
|
Mining and quarrying, manufacturing (B and C) |
5.6 |
5.7 |
|
Mining
and quarrying (B) |
−11.3 |
−10.3 |
|
Manufacturing (C) |
5.8 |
5.8 |
|
Manufacturing (except for the manufacture
of refined petroleum products) (C excl. C19) |
8.2 |
8.5 |
|
Electricity, gas, steam and air conditioning supply (D) |
5.5 |
5.6 |
|
Water supply, sewerage, waste management and
remediation activities (only Division 36 of Section E – water collection,
treatment and supply) |
4.3 |
4.2 |
|
Main industrial groupings |
|
|
|
Energy products |
−1.0 |
−1.1 |
|
Intermediate goods |
9.7 |
9.7 |
|
Capital goods |
16.5 |
17.6 |
|
Consumer durables |
6.9 |
7.2 |
|
Consumer non-durables |
1.9 |
2.2 |
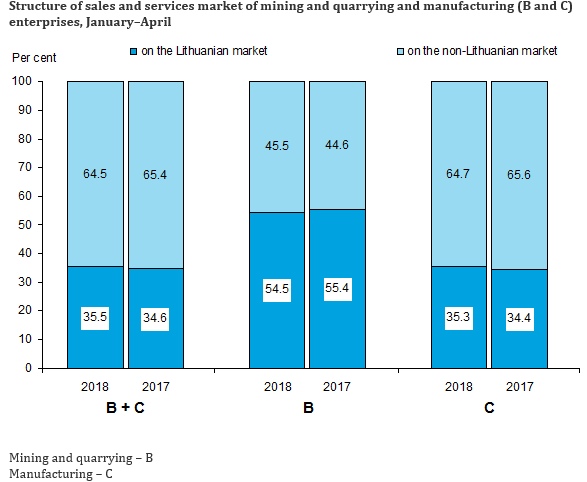
The proportion of sales of industrial production on the non-Lithuanian market decreased by 0.9 percentage points and stood at 64.5%, on the Lithuanian market – increased by 0.9 percentage points and stood at 35.5%. The value of sales to non-euro area countries accounted for more than half (53%) of the total value of sales on the non-Lithuanian market.
In January–April 2018, against the same period of 2017, the value of sales of the production of industrial enterprises on the non-Lithuanian market increased by 7.1% at current prices. The increase was determined by an increase in the sales of the production of the manufacture of chemicals and chemical products (10.4%), furniture (14.1%), fabricated metal products, except machinery and equipment (18.6%). Refined petroleum products excluded, the value of sales on the non-Lithuanian market increased by 11% at current prices. The value of sales to euro area countries increased by 10.9, to non-euro area countries – 4% at current prices.
The value of sales of industrial production on the Lithuanian market increased by 11.3, refined petroleum products excluded – 10.9% at current prices.
Concepts
Sales and services of industrial enterprises refers to income (VAT and excise excluded) received during a reference period through selling goods and (or) providing services by enterprises engaged in mining and quarrying, manufacturing (B and C sections according to EVRK Rev. 2).
Industrial production refers to the value (VAT and excise excluded) of the sales of goods manufactured or manufacturing work carried out by an enterprise (B_C_D_E sections according to EVRK Rev.2). For the calculation of changes in industrial production, a producer price index is used.
A news release on changes in industrial production in May 2018 is due on 23 June 2018. More information is available in the Database of Indicators.


 «The Baltic Course» Is Sold and Stays in Business!
