
Analytics, Employment, EU – Baltic States, Financial Services, Labour-market, Latvia, Wages
International Internet Magazine. Baltic States news & analytics
Saturday, 20.04.2024, 15:46
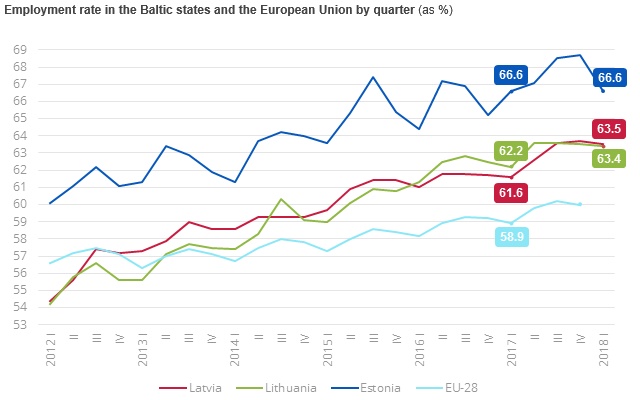
In Q1, 63.5% Latvia’s population were employed
 Print version
Since the 4th quarter of 2012, Latvian employment rate exceeds European Union (EU) average level (in the 4th quarter of 2017 it constituted 60.0%). In the 1st quarter of 2018, Latvian employment rate exceeded that in Lithuania (63.4%) by 0.1 percentage points, however was lower than in Estonia (66.6%).
In the 1st quarter of 2018, the employment rate among young people (aged 15–24) constituted 31.7%, which is 1.1 percentage points higher than in the corresponding quarter year before. Out of all young people, 54.9 thousand were employed.
In the 1st quarter of 2018, persons employed in the main job worked on average 38.4 hours per week, which is 0.1 hours fewer than in the 1st quarter of 2017.
Over the year (since the 1st quarter of 2017), the share of employees receiving less than EUR 450.00 monthly (after taxes) fell to 34.9% (a drop of 7.0 percentage points), the proportion of employees receiving minimum monthly wage1 or less constituted 162.7 thousand or 20.5% (reduction of 0.9 percentage points). The share of employees receiving EUR 450.01–700.00 monthly rose by 2.1 percentage points (33.7% in Q1 2018) and that of employees receiving EUR 700.01–1400.00 monthly increased by 4.4 percentage points (22.6% in Q1 2017). The proportion of employees receiving more than EUR 1400 monthly grew by 0.5 percentage points. In its turn, wage or salary of 1.6% of employees was not calculated or paid, while 2.9% did not indicate the size of earnings thereof.
Employees by monthly net wages and salaries in the main job (as %)
|
|
Q1 2017 |
Q4 2017 |
Q1 2018 |
|
Employees |
100.0 |
100.0 |
100.0 |
|
up to EUR 450.00 |
41.9 |
37.0 |
34.9 |
|
employees receiving minimum monthly wage or less |
21.4 |
17.4 |
20.5 |
|
EUR 450.01–700.00 |
31.6 |
33.4 |
33.7 |
|
EUR 700.01–1400.00 |
18.2 |
21.9 |
22.6 |
|
EUR 1400.01 and more |
3.8 |
3.3 |
4.3 |
|
was not
calculated or paid |
2.3 |
2.3 |
1.6 |
|
not specified |
2.2 |
2.1 |
2.9 |
In the 1st quarter of 2018, Labour Force Survey covered 4.1 thousand households, in which 7.4 thousand people aged 15–74 were interviewed.
Results of the Labour Force Survey are published in the CSB database section Employment and Unemployment.
1In 2017, minimum wage constituted EUR 380, in 2018 – EUR 430.


 «The Baltic Course» Is Sold and Stays in Business!
