
Analytics, Baltic Export, Foreign trade , Latvia, Markets and Companies
International Internet Magazine. Baltic States news & analytics
Saturday, 20.04.2024, 08:24
In March, foreign trade turnover in Latvia decreased by 2.7% y-o-y
 Print version
Over the first quarter of this year, the foreign trade turnover of Latvia at current prices reached EUR 6.26 billion – EUR 344.7 million or 5.8% more than in the corresponding period of 2017. The exports value constituted EUR 2.86 billion (an increase of EUR 176.6 million or 6.6%), whereas the imports value – EUR 3.4 billion (an upturn of EUR 168.1 million or 5.2%).
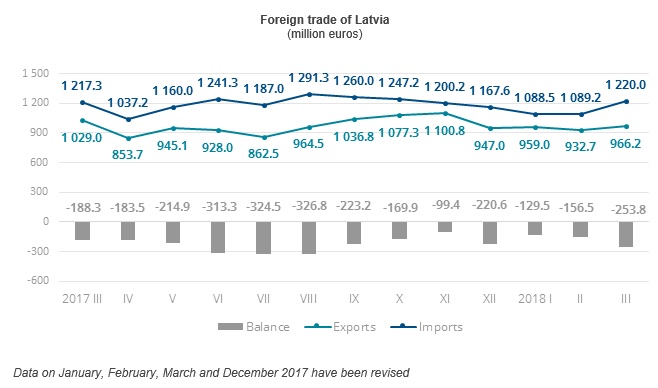
Calendar and seasonally adjusted data at current prices show that, compared to March 2017, in March 2018 the exports value at current prices reduced by 1.1%, but the imports value – went up by 5.9%, whereas, compared to the previous month, the exports value decreased by 5.7%, the imports value – increased by 0.2%.
Main changes in exports in March 2018, compared to March 2017:
- exports of vegetable products down by
EUR 41.0 million or 60.2%,
- exports of vehicles and associated
transport equipment down by EUR 19.5 million or 23.6%,
- exports of machinery and mechanical
appliances; electrical equipment down by EUR 8.2 million or 4.7%,
- exports of products of the chemical and
allied industries down by EUR 7.8 million or 9.5%,
- exports of basic metals and articles of
basic metals up by EUR 14.8 million or 16.8%.
Main changes in imports in March 2018, compared to March 2017:
- imports of basic metals and articles
of basic metals up by EUR 26.8 million or 28.8%,
- imports of mineral products up by
EUR 14.3 million or 14.4%,
- imports of products of the chemical and
allied industries up by EUR 10.4 million or 7.4%,
- imports of vegetable products up by
EUR 7.4 million or 13.5%,
- imports of textiles and textile
articlesdown by EUR 6.5 million or 13.6%.
In March, the main export partners of Latvia in trade with EU countries were Lithuania (16.4% of total exports), Estonia (12.6%), Germany (7.6%) and Sweden (7.3%), whereas the main import partners were Lithuania (16.4% of total imports), Germany (11.5%), Poland (10.2%) and Estonia (7.3%).
Foreign trade of Latvia by country groups in March 2018, (at current prices)
|
|
Exports |
Imports |
||||
|
|
million EUR |
% of total |
changes as%, compared to March 2017 |
million EUR |
% of total |
changes as%, compared to March 2017 |
|
Total |
966.2 |
100 |
-6.1 |
1 220.0 |
100 |
0.2 |
|
European Union countries |
715.7 |
74.1 |
-8.0 |
930.2 |
76.2 |
-0.9 |
|
euro area countries |
480.6 |
49.7 |
-10.7 |
674.0 |
55.2 |
-2.0 |
|
CIS countries |
129.1 |
13.4 |
10.2 |
160.4 |
13.1 |
44.0 |
|
other countries |
121.4 |
12.5 |
-9.5 |
129.4 |
10.7 |
-22.8 |
The main partner in trade with third countries was Russia, share of which in total Latvian exports in March accounted for 9.1%, but in imports – 9.6%.
Main commodities in exports of Latvia in March 2018 (at current prices)
|
|
thousand EUR |
as% of total |
Changes as%,
compared to |
||
|
March 2017 |
February 2018 |
average of
previous 12 months |
|||
|
Total |
966 236 |
100 |
-6.1 |
3.6 |
-0.4 |
|
wood and articles of wood; wood charcoal |
190 717 |
19.7 |
4.1 |
14.5 |
19.6 |
|
electrical machinery and equipment |
107 325 |
11.1 |
-8.7 |
2.4 |
2.2 |
|
machinery and mechanical
appliances |
61 372 |
6.4 |
3.4 |
-15.0 |
-9.0 |
|
vehicles other than railway or tramway rolling stock, and parts and
accessories thereof |
58 918 |
6.1 |
4.3 |
-3.6 |
10.4 |
|
iron and steel |
45 554 |
4.7 |
27.0 |
60.5 |
27.2 |
|
mineral fuels, mineral oils and products of their distillation |
40 218 |
4.2 |
-1.0 |
1.9 |
-2.4 |
|
beverages, spirits and vinegar |
37 933 |
3.9 |
2.0 |
-2.6 |
-23.9 |
|
articles of iron and steel |
36 891 |
3.8 |
8.0 |
17.3 |
14.7 |
|
pharmaceutical products |
35 668 |
3.7 |
-5.5 |
8.8 |
-0.1 |
|
furniture, other furnishing articles; prefabricated buildings |
26 767 |
2.8 |
-10.5 |
15.0 |
-6.2 |
Rise of exports of iron and steel in March 2018, as compared to March 2017, was affected by the increase in exports of waste and scrap of cast iron of EUR 8.6 million or 2.4 times. In turn, a drop was experienced in the exports of furniture, other furnishing articles; prefabricated buildings as exports of wooden furniture fell by EUR 4.3 million or by 37.5%.
Main commodities in imports of Latvia in March 2018 (at current prices)
|
|
thousand EUR |
as% of total |
Changes as%,
compared to |
||
|
March 2017 |
February 2018 |
average of
previous 12 months |
|||
|
Total |
1 220 002 |
100 |
0.2 |
12.0 |
3.2 |
|
machinery and mechanical
appliances |
130 403 |
10.7 |
17.3 |
15.3 |
5.8 |
|
electrical machinery and equipment |
112 729 |
9.2 |
-12.4 |
-4.1 |
-14.5 |
|
mineral fuels, mineral oils and products of their distillation |
109 543 |
9.0 |
14.7 |
39.3 |
7.5 |
|
vehicles other than railway or tramway rolling stock, and parts and
accessories thereof |
104 703 |
8.6 |
-0.9 |
34.2 |
3.5 |
|
iron and steel |
64 381 |
5.3 |
59.0 |
33.7 |
42.1 |
|
pharmaceutical products |
55 205 |
4.5 |
11.6 |
5.2 |
9.4 |
|
plastics and articles thereof |
48 602 |
4.0 |
-6.2 |
5.4 |
-4.1 |
|
wood and articles of wood; wood charcoal |
44 692 |
3.7 |
6.4 |
1.3 |
12.7 |
|
beverages, spirits and vinegar |
37 798 |
3.1 |
13.0 |
-1.6 |
-16.6 |
|
miscellaneous chemical products |
34 918 |
2.9 |
9.2 |
3.1 time |
2.5 times |
Rise of imports of iron and steel in March 2018, as compared to March 2017, was mostly affected by the increase in imports of flat rolled products of iron and non-alloy steel of EUR 18.1 million or 94.3%. In turn, a drop was experienced in the imports of electrical machinery and equipment, as the imports of telephone sets and of other apparatus for the transmission or reception of voice, images or other data dropped by EUR 7.4 million or 15.1%.
More information on the foreign trade of Latvia by month and quarter, as well as by country group and commodity group is available in the Foreign trade section of the CSB database.


 «The Baltic Course» Is Sold and Stays in Business!
