
Analytics, EU – Baltic States, Inflation, Lithuania, Markets and Companies
International Internet Magazine. Baltic States news & analytics
Friday, 26.04.2024, 00:27
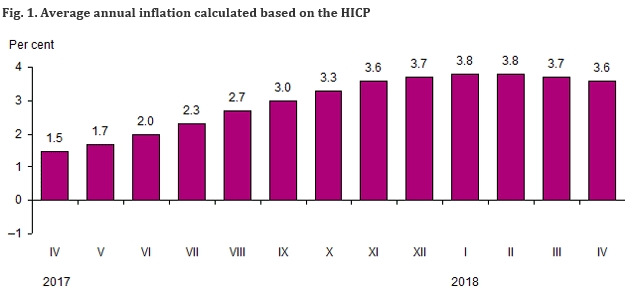
Harmonized average annual inflation in Lithuania constituted 3.6% in April
 Print version
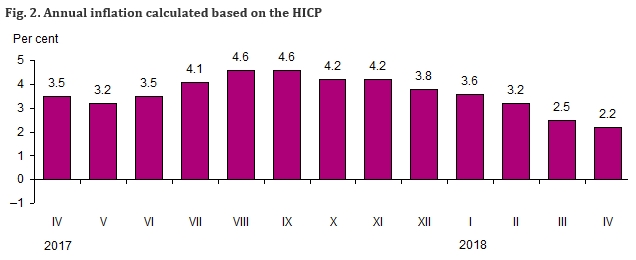
In April 2018, annual inflation (April 2018, against April 2017) calculated based on the HICP stood at 2.2% and was by 0.1 percentage points lower than the CPI-based one.
In April 2018, against March, the increase in prices for consumer goods and services calculated based on the HICP stood at 0.7%, the CPI-based one – at 0.6%.
Table 1. Rates of change in prices for consumer goods and services calculated based on the HICP, April 2018
|
ECOICOP1 divisions
of consumer goods and services |
Relative share
(weight) in total consumption expenditure, ‰ |
Price growth, drop (–), % |
||
|
April 2018, against |
Average annual April 2016–2017 |
|||
|
March 2018 |
April 2017 |
|||
|
Consumption goods and services |
1 000.0 |
0.7 |
2.2 |
3.6 |
|
Food products and
non-alcoholic beverages |
203.8 |
1.5 |
2.8 |
3.3 |
|
Alcoholic beverages and
tobacco products |
78.2 |
0.0 |
2.1 |
10.3 |
|
Clothing and footwear |
69.0 |
3.5 |
0.5 |
1.2 |
|
Housing, water, electricity,
gas and other fuels |
106.2 |
–0.9 |
4.1 |
3.4 |
|
Furnishings, household
equipment and routine maintenance |
71.1 |
0.4 |
0.7 |
0.8 |
|
Health care |
58.1 |
1.0 |
1.2 |
0.8 |
|
Transport |
154.9 |
0.9 |
1.1 |
3.6 |
|
Communications |
28.8 |
0.1 |
–1.7 |
0.2 |
|
Recreation and culture |
84.9 |
0.4 |
3.1 |
2.9 |
|
Education |
12.9 |
0.4 |
2.9 |
2.4 |
|
Hotels, cafes and restaurants |
55.0 |
0.8 |
4.6 |
6.7 |
|
Miscellaneous goods and services |
77.1 |
–0.1 |
2.5 |
4.7 |
_________________
1 European Classification of Individual Consumption According to Purpose (ECOICOP).
For the calculation of annual and average annual inflation, monthly price changes and price changes for other periods, the HICPs calculated based on the 2015 index base period (2015 = 100) accurate to two decimal places are used. Price indices are published accurate to two decimal places, inflation and price changes – to one decimal place.
Table 2. ECOICOP classes of consumer goods and services whose rates of change in prices had the biggest impact on the overall price change
|
ECOICOP classes of consumer goods and services |
Relative share (weight) in total consumption
expenditure, ‰ |
Price growth, drop (–), % |
Impact, percentage points |
|
April 2018, against March 2018 |
|||
|
Vegetables |
21.1 |
12.6 |
+0.256 |
|
Clothing |
46.5 |
3.6 |
+0.159 |
|
Package holidays |
10.0 |
6.8 |
+0.068 |
|
Passenger transport by air |
10.0 |
7.7 |
+0.063 |
|
Footwear |
18.4 |
3.5 |
+0.059 |
|
Pharmaceuticals |
33.0 |
1.2 |
+0.039 |
|
Recreation and sport services |
13.2 |
–0.9 |
–0.012 |
|
Wine and wine products |
12.4 |
–1.0 |
–0.012 |
|
Garden tools, plants and
flowers |
9.1 |
–1.7 |
–0.017 |
|
Products and materials for
the maintenance and repair of the dwelling |
15.3 |
–2.0 |
–0.031 |
|
Other services n.e.c. |
12.6 |
–2.4 |
–0.032 |
|
Heat energy |
28.0 |
–2.2 |
–0.064 |
|
April 2018, against April 2017 |
|||
|
Milk and milk products,
cheese, eggs |
39.0 |
6.5 |
+0.258 |
|
Tobacco products |
26.9 |
9.0 |
+0.243 |
|
Solid fuel |
11.8 |
19.4 |
+0.227 |
|
Catering services of
restaurants, cafés and the like |
32.5 |
6.2 |
+0.185 |
|
Oil and fats |
10.5 |
13.2 |
+0.137 |
|
Fruit |
11.0 |
9.0 |
+0.102 |
|
Passenger transport by air |
10.0 |
–6.0 |
–0.056 |
|
Sugar, jam, honey, chocolate
and confectionery |
11.6 |
–3.9 |
–0.057 |
|
Wine and wine products |
12.4 |
–3.5 |
–0.058 |
|
Spirits |
18.5 |
–1.6 |
–0.059 |
|
Other appliances, articles
and products for personal care |
21.8 |
–2.9 |
–0.077 |
|
Pharmaceuticals |
33.0 |
–2.9 |
–0.082 |
The overall change in consumer prices is influenced not only by the size of the price change for a certain product but also by the relative share (weight) of expenditure on that product in the total consumption expenditure.
Concepts
Inflation is a long-term increase in the general price level, resulting in a decrease in the purchasing power of money. Inflation is usually calculated based on the consumer price index and expressed in%.
Annual inflation shows the relative change in the average price level in the reporting month and the corresponding month of the previous year.
Average annual inflation shows the relative change in the average price level in the last twelve months and the corresponding previous twelve months.
Harmonized index of consumer prices – a consumer price index compiled according to a methodology harmonised across the European Union.
Consumer price index – a relative indicator reflecting the overall change in prices for consumer goods and services purchased by households to satisfy their consumption needs over a certain period of time.
A news release on the May 2018 inflation calculated based on the HICP is due on 11 June 2018.
For more information on the issue, please see the Database of Indicators and Eurostat’s website.


 «The Baltic Course» Is Sold and Stays in Business!
