
Analytics, Employment, EU – Baltic States, Financial Services, Latvia, Wages
International Internet Magazine. Baltic States news & analytics
Friday, 26.04.2024, 01:55
In 2017, 62.9% Latvia’s population were employed
 Print version
Compared to the year before,
in 2017 employment rate grew by 1.3 percentage points and number of
employed persons by 1.5 thousand. Employment rate among men grew faster
than among women – by 1.6 percentage points and 1.0 percentage
points, respectively.
In the 4th quarter
of 2017, 902.2 thousand people aged 15–74 were employed, which is
0.7 thousand less than in the 3rd quarter. Employment rate
constituted 63.7%, which is 0.1 percentage points higher than in the 3rd quarter.
Compared to the year before,
in 2017 the most notable increase in the number of employed persons was
observed in wholesale and retail trade; repair of motor vehicles and
motorcycles, as well as professional, scientific and technical activities, and
information and communication.
In 2017, 2.4 thousand of
the employed persons participated in active employment activities organised by
the State Employment Agency, e.g., had paid temporary community work while
still having the status of unemployed.
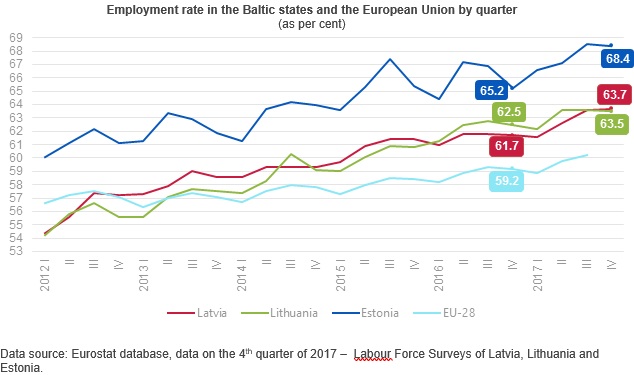
Since the 4th quarter
of 2012, Latvian employment rate has been exceeding European Union (EU) average
level (which in the 3rd quarter of 2017 constituted 60.2%). In
the 4th quarter of 2017, Latvian employment rate exceeded
Lithuanian rate (by 63.5%), however was still lower than Estonian one (68.4%).
In 2017, employment rate among
young people (aged 15–24) constituted 33.0%, which is
0.2 percentage points higher than in 2016. Last year, the
number of employed young people accounted for 59.1 thousand
(62.9 thousand in 2016). Compared to the 3rd quarter, in
the 4th quarter of 2017 number of employed young people dropped
by 8.3 thousand or 13.4% and constituted 53.8 thousand.
In 2017, persons employed in
the main job worked on average 38.3 hours per week (0.1 hours fewer than
in 2016), whereas in the 4th quarter of the year –
38.1 hours per week (0.7 hours fewer than in the 3rd quarter
of 2017).
Data of the Labour Force Survey
show that, compared to 2016, in 2017 share of employees receiving less than EUR
450.00 monthly (after taxes) fell to 39.2% (drop of 4.9 percentage
points), while the proportion of employees receiving minimum monthly wage1 or
less constituted 149.4 thousand or 19.1% (reduction of 1.6 percentage
points over the year). Also in the 4th quarter of 2017, as
compared to the 3rd quarter, the share of employees receiving
less than EUR 450.00 monthly (after taxes) dropped to 37.0% (decline of
1.9 percentage points), and the proportion of employees receiving minimum
monthly wage or less constituted 136.4 thousand or 17.4% (reduction of
1.3 percentage points).Compared to 2016, in 2017 the share of employees
receiving EUR 450.01–700.00 monthly rose by 1.7 percentage points
(32.4% in 2017) and that of employees receiving EUR 700.01–1400.00 monthly
increased by 2.6 percentage points (20.2% in 2017); the proportion of
employees receiving more than EUR 1400 monthly grew by
0.7 percentage points (3.4% in 2017).In its turn, wage or salary of 2.7%
of employees was not calculated or paid, while 2.1% did not indicate the size
of earnings thereof.
Employees by monthly net wages
and salaries in the main job (as per cent)
|
|
2016 |
2017 |
2017 |
|||
|
Q1 |
Q2 |
Q3 |
Q4 |
|||
|
Employees |
100.0 |
100.0 |
100.0 |
100.0 |
100.0 |
100.0 |
|
up to EUR
450.00 |
44.1 |
39.2 |
41.9 |
39.2 |
38.9 |
37.0 |
|
employees receiving minimum monthly wage1 or less |
20.7 |
19.1 |
21.4 |
18.9 |
18.7 |
17.4 |
|
EUR
450.01–700.00 |
30.7 |
32.4 |
31.6 |
31.8 |
32.8 |
33.4 |
|
EUR
700.01–1400.00 |
17.6 |
20.2 |
18.2 |
19.7 |
20.8 |
21.9 |
|
EUR
1400.01 and more |
2.7 |
3.4 |
3.8 |
3.7 |
2.6 |
3.3 |
|
was not calculated or paid |
3.1 |
2.7 |
2.3 |
3.4 |
2.9 |
2.3 |
|
not
specified |
1.8 |
2.1 |
2.2 |
2.2 |
1.9 |
2.1 |
1In 2016, minimum wage constituted EUR 370, in 2017 – EUR 380.
In 2017, Labour Force Survey covered
16.5 thousand households, in which 30.4 thousand people aged 15–74
were interviewed. In the 4th quarter of the year, Labour Force
Survey covered 4.1 thousand households, in which 7.5 thousand people
aged 15–74 were interviewed.
More information on employment
statistics is available in the CSB database section Employment and Unemployment – Key Indicators. Results of the Labour Force Survey are published in the CSB database
section Employment and Unemployment (Short term statistical data and Annual statistical data).


 «The Baltic Course» Is Sold and Stays in Business!
