
Analytics, Industry, Lithuania, Markets and Companies
International Internet Magazine. Baltic States news & analytics
Thursday, 25.04.2024, 21:42
In January, prices for the industrial production in Lithuania increased by 0.8%
 Print version
Over the month, prices for industrial production sold on the Lithuanian market increased by 0.2%, refined petroleum products excluded – remained almost unchanged. The largest increase in prices was observed for the production of manufacture of basic metals – 5%. The largest decrease in prices was recorded for the manufacture of beverages – 2.7%. Among food products, fruit, berries and vegetable juice went up in price by 15.9, meat and poultry products – 4.8%, while rusks and biscuits, preserved pastry goods and cakes went down in price by 2.6, milk and cheese products – 1.8%.
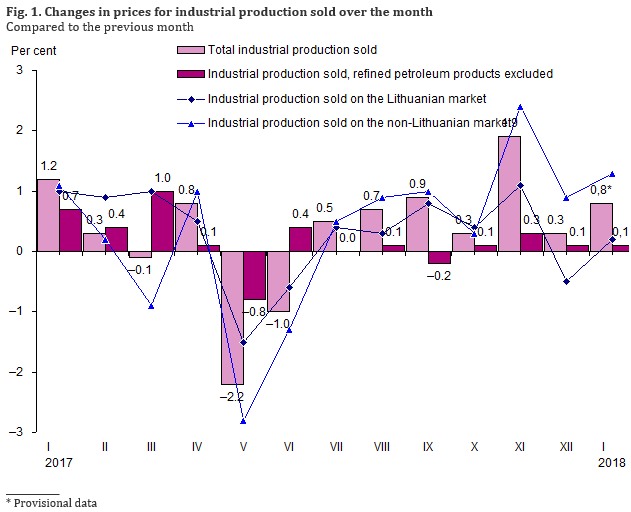
Over the month, prices for industrial production sold on the non-Lithuanian market increased by 1.3%, refined petroleum products excluded – 0.3%.
Over the month, the overall price change for industrial production sold on the euro area market increased by 1.8, on the non-euro area market – 1%.
Table 1. The greatest influence on the monthly
(January 2018, against December 2017) change in prices for industrial
production sold by economic activity
|
Economic activities |
Price growth, drop (–),% |
Influence, |
|
Total industrial production sold |
||
|
Manufacture of
refined petroleum products |
3.4 |
+0.704 |
|
Manufacture of tobacco products |
14.6 |
+0.048 |
|
Manufacture of
fabricated metal products, except machinery and equipment |
1.3 |
+0.043 |
|
Manufacture of
chemicals and chemical products |
0.4 |
+0.034 |
|
Manufacture of
rubber and plastic products |
0.6 |
+0.029 |
|
Manufacture of textiles |
–0.5 |
–0.010 |
|
Manufacture of
motor vehicles, trailers and semi-trailers |
–1.2 |
–0.016 |
|
Repair and installation
of machinery and equipment |
–1.1 |
–0.020 |
|
Manufacture of beverages |
–1.6 |
–0.046 |
|
Electricity,
gas, steam and air conditioning supply |
–1.0 |
–0.084 |
|
Industrial production sold on the Lithuanian
market |
||
|
Manufacture of
refined petroleum products |
1.7 |
+0.202 |
|
Manufacture of food products |
0.4 |
+0.090 |
|
Manufacture of
paper and paper products |
2.0 |
+0.054 |
|
Manufacture of
wood and of products of wood, except furniture |
0.9 |
+0.037 |
|
Manufacture of
chemicals and chemical products |
1.0 |
+0.037 |
|
Manufacture of textiles |
–0.4 |
–0.004 |
|
Manufacture of electrical equipment |
–0.6 |
–0.005 |
|
Manufacture of
motor vehicles, trailers and semi-trailers |
–2.6 |
–0.020 |
|
Manufacture of beverages |
–2.7 |
–0.140 |
|
Electricity,
gas, steam and air conditioning supply |
–1.0 |
–0.205 |
|
Industrial production sold on the
non-Lithuanian market |
||
|
Manufacture of
refined petroleum products |
3.9 |
+1.051 |
|
Manufacture of tobacco products |
14.6 |
+0.081 |
|
Manufacture of
fabricated metal products, except machinery and equipment |
2.0 |
+0.069 |
|
Manufacture of
rubber and plastic products |
0.9 |
+0.049 |
|
Manufacture of wearing apparel |
1.6 |
+0.040 |
|
Manufacture of
paper and paper products |
–0.7 |
–0.012 |
|
Manufacture of
motor vehicles, trailers and semi-trailers |
–0.7 |
–0.013 |
|
Manufacture of textiles |
–0.6 |
–0.014 |
|
Repair and
installation of machinery and equipment |
–2.6 |
–0.048 |
|
Manufacture of food products |
–0.8 |
–0.095 |
_____________
1National version of NACE Rev. 2
The overall change in prices for industrial production sold is influenced not only by the rate of change in the price of a certain product but also by the relative share (weight) of the industrial production sold within certain economic activity in the total industrial production.
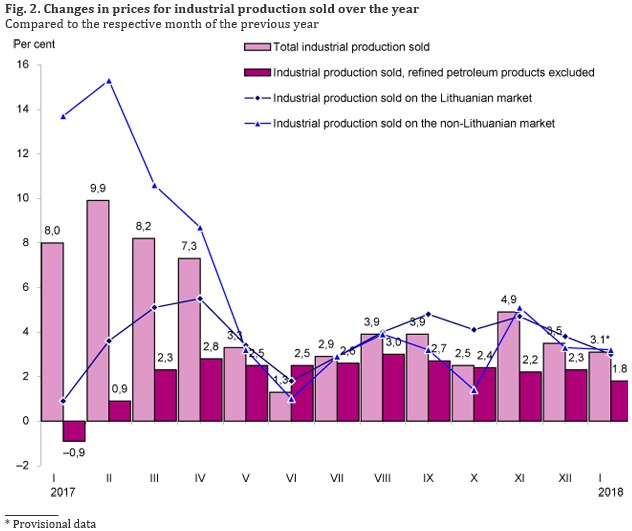
Over the year (January 2018, against January 2017), prices for the total industrial production sold increased by 3.1%, refined petroleum products excluded – 1.8%.
Over the year, prices for industrial production sold on the Lithuanian market increased by 3%, refined petroleum products excluded – 1.8%.
Over the year, prices for industrial production sold on the non-Lithuanian market increased by 3.2%, refined petroleum products excluded – 1.7%.
Over the year, prices for industrial production sold on the euro area market increased by 2.1, on the non-euro area market – 4%.
Table 2. Changes in prices for industrial production
sold, January 2018, %
|
Economic activity |
Relative |
Price growth,
drop (–) January 2018, against |
|
|
2017 |
|||
|
December |
January |
||
|
Total industrial production sold |
100.0 |
0.8 |
3.1 |
|
Mining and quarrying |
0.9 |
0.6 |
5.0 |
|
Manufacturing |
90.3 |
1.0 |
3.3 |
|
Manufacture of
refined petroleum products |
20.8 |
3.4 |
8.3 |
|
Electricity,
gas, steam and air conditioning |
8.0 |
−1.0 |
0.2 |
|
Water supply;
sewerage, waste management and remediation activities |
0.8 |
0.7 |
5.3 |
|
Total industrial production, refined petroleum products excluded |
79.2 |
0.1 |
1.8 |
|
Manufacturing
production, refined petroleum products excluded |
69.5 |
0.3 |
1.8 |
|
Total industrial production sold on the
Lithuanian market |
100.0 |
0.2 |
3.0 |
|
Mining and quarrying |
1.3 |
0.7 |
2.8 |
|
Manufacturing |
77.6 |
0.5 |
3.7 |
|
Manufacture of
refined petroleum products |
11.9 |
1.7 |
12.2 |
|
Electricity,
gas, steam and air conditioning supply |
19.7 |
−1.0 |
0.2 |
|
Water supply;
sewerage, waste management and remediation activities |
1.4 |
1.1 |
4.1 |
|
Total industrial production sold on the
Lithuanian market, refined petroleum products excluded |
88.1 |
0.0 |
1.8 |
|
Manufacturing
production, refined petroleum products excluded |
65.7 |
0.3 |
2.2 |
|
Total industrial production sold on the
non-Lithuanian market |
100.0 |
1.3 |
3.2 |
|
Mining and quarrying |
0.5 |
0.5 |
9.5 |
|
Manufacturing |
99.1 |
1.3 |
3.1 |
|
Manufacture of
refined petroleum products |
27.0 |
3.9 |
7.2 |
|
Electricity,
gas, steam and air conditioning supply |
- |
- |
- |
|
Water supply;
sewerage, waste management and remediation activities |
0.4 |
−0.4 |
7.6 |
|
Total industrial production sold on the
non-Lithuanian market, refined petroleum products excluded |
73.0 |
0.3 |
1.7 |
|
Manufacturing
production, refined petroleum products excluded |
72.1 |
0.3 |
1.6 |
|
Total
industrial production sold on the euro area market |
100.0 |
1.8 |
2.1 |
|
Total
industrial production sold on the non-euro area market |
100.0 |
1.0 |
4.0 |
_______________
- Such a phenomenon (indicator) was not observed during the respective period.
The new weighting system for the calculation of the PPI in 2018 is based on the 2016 year data on industrial production sold classified under the Classification of Products and Services (Produktų, gaminių ir paslaugų klasifikatorius, PGPK) in value terms. According to the Laspeyres formula used in calculations, the base period data need to match the weightings’ data. The base period is December 2017, i.e. in 2018 monthly prices are compared against the said base period. Therefore, the statistical data on the amount of production sold in 2016 were recalculated using the indices of producer prices for industrial production sold and expressed in December 2017 prices.
The current weighting system comprises 545 selected PGPK codes. The share of industrial production sold under these product categories accounts for 80% of the total industrial production sold in 2016.
764 industrial enterprises participate in the statistical survey. Every month, they provide prices for 1979 representative products; out of them, 602 enterprises – on 1200 prices for products sold on the Lithuanian market and 386 enterprises – on 779 prices for products sold on the non-Lithuanian market.
A press release on the February 2018 PPI is due on 9 March 2018.
For more information on the issue, please see the Database of Indicators.


 «The Baltic Course» Is Sold and Stays in Business!
