
Analytics, Financial Services, Latvia, Society
International Internet Magazine. Baltic States news & analytics
Friday, 19.04.2024, 15:09
22.1% Latvia’s population at risk of poverty
 Print version
In 2016, as disposable income2 of
the population grew, also at-risk-of-poverty threshold went up – to
330 euros monthly (318 euros monthly in 2015).
After the sharp decline of 4.6%age
points in 2015, the share of children at-risk-of-poverty did not change
significantly and in 2016 constituted 18.4% (18.6% in 2015). In households
consisting of one adult with dependent children, at-risk-of-poverty is still
high and reaches 34.3% (34.4% in 2015).
At-risk-of-poverty in
households consisting of two adults with three or more children has dropped
notably – from 25.5% in 2015 to 19.8% in 2016. Significantly lower
at-risk-of-poverty was observed in households consisting of two adults with one
or two children – 13.4% and 14.4%, respectively.
In 2016, the share of
population at-risk-of-poverty has risen within the population age group over
65 years (from 38.1% in 2015 to 39.9% in 2016). Very high
at-risk-of-poverty is observed among single elderly population – if person aged
over 65 lives alone, the indicator constitutes 72.8%.
At-risk-of-poverty rate by age
group; 2008–2016 (as %)
|
|
2008 |
2009 |
2010 |
2011 |
2012 |
2013 |
2014 |
2015 |
2016 |
|
Total |
26.4 |
20.9 |
19.0 |
19.2 |
19.4 |
21.2 |
22.5 |
21.8 |
22.1 |
|
0–17 |
26.3 |
26.3 |
24.7 |
24.4 |
23.4 |
24.3 |
23.2 |
18.6 |
18.4 |
|
18–64 |
20.5 |
20.4 |
20.2 |
19.3 |
18.8 |
18.4 |
18.6 |
17.7 |
17.5 |
|
65+ |
47.6 |
17.2 |
9.1 |
13.9 |
17.6 |
27.6 |
34.6 |
38.1 |
39.9 |
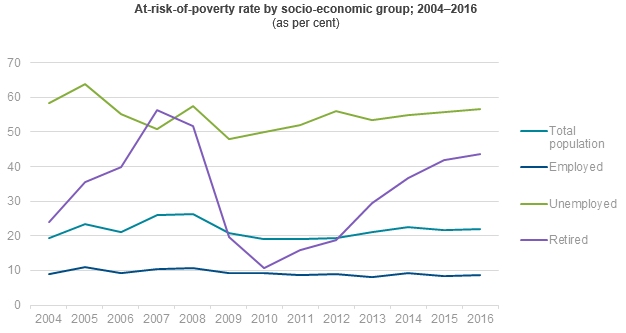
Every year, very high
at-risk-of-poverty (exceeding 50%, except for 2009 when those were 47.9%) was
faced by unemployed persons; in 2016 the indicator reached 56.5%. For
comparison, at-risk-of-poverty among employed persons constituted only 8.8% in
2016 (8.3% in 2015).
The data source of the
relative poverty and social exclusion indicators is the European Union
Statistics on Income and Living Conditions (EU-SILC) survey of 2017 conducted
by the CSB. The survey covered 6 thousand households and
11.3 thousand respondents aged 16 and over. The CSB will collect data on
the household poverty risk in 2017 within the framework of the survey of 2018,
and respondents will have a possibility to fill in the questionnaire online.
More information on the
results of the survey is available in the CSB database section Monetary Poverty and
Income Inequality.
Methodological explanations
The CSB monetary poverty and
social exclusion indicators on 2016 reflect the information on population
income received in 2016. Unlike the approach used by the CSB, Eurostat
(Statistical Office of European Union) publishes monetary poverty and social
exclusion indicators with a reference to the year the survey was conducted,
nevertheless the population income data included in the indicator are compiled
on the previous calendar year. On 16 October 2017, Eurostat
published EU-SILC 2016 results reflecting poverty and social exclusion
statistics, the Latvian income and poverty risk data presented covered the year
2015.
1At-risk-of-poverty rate – share of persons with equivalised disposable income below 60% of the
national median equivalised disposable income.
2At-risk-of-poverty thresholdrepresents 60%
of the median equivalised disposable income.
Median is a statistical indicator characterising central value (midpoint of the
breakdown) of the observations grouped from the lowest value to the highest.
Disposable (net) income– cash income from labour, employee income in kind received by using
company car for private needs estimated in cash, income or losses received from
self-employment, pensions and benefits received, regular material assistance
from other households, profit from deposit interest, dividends, shares,
income received by children aged under 16, income from property rental,
tax return from the State Revenue Service due to overpaid income tax (for
business activities, eligible costs – education, medical treatment, etc.).
Equivalent disposable (net)
income – household disposable income
calculated per equivalent consumer. It is obtained by dividing household income
by equivalised household size, which is made using the modified OECD equivalence
scale (1.0; 0.5; 0.3). This scale gives a weight of 1.0 to the first adult, 0.5
to any other household member aged 14 and over, and 0.3 to each child aged less
than 14.


 «The Baltic Course» Is Sold and Stays in Business!
