
Analytics, Baltic Export, Baltic States – CIS, EU – Baltic States, Foreign trade , Lithuania, Markets and Companies
International Internet Magazine. Baltic States news & analytics
Thursday, 25.04.2024, 16:15
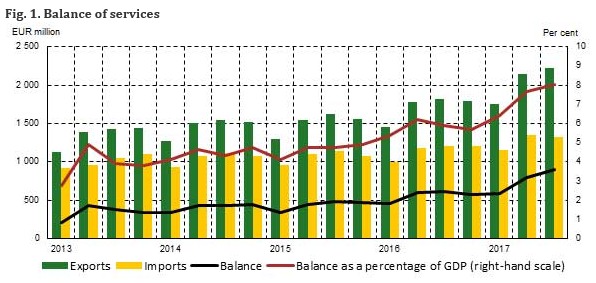
In Q3, exports of services amounted to EUR 2.2 bln, imports – EUR 1.3 bln in Lithuania
 Print version
During the quarter, compared to the respective period of the previous year, the largest growth (62.4%) was recorded in the exports of telecommunications, computer and information services, as well as in imports of these and transport services (16.9% each).
The bulk of exports and imports of services (56.1 and 52.7% respectively) consisted of transport services. In III quarter 2017, the largest surplus (EUR 413.7 million) was recorded on the balance of road transport services, the largest deficit (EUR 65.3 million) – on the balance of sea transport services.
The exports of services to EU countries accounted for 64.7, to CIS countries – for 21.2% of the total exports of services; the imports of services from EU countries accounted for 63.1, from CIS countries – for 21.6% of the total imports of services.
In III quarter 2017, compared to the respective quarter of the previous year, exports of services to EU countries increased by 27.7, to CIS countries – 11.5%. Over the year, imports from EU countries grew by 9.2, from CIS countries – 8.1%.
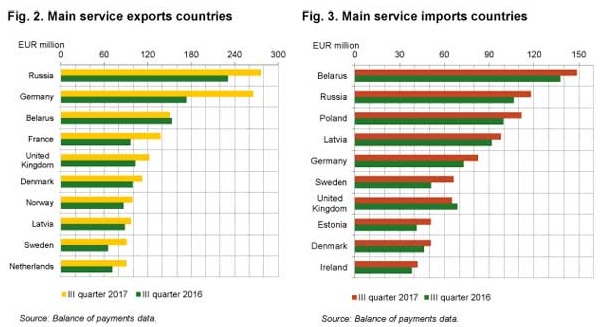
Russia remains the main Lithuania’s partner in the exports of services. Over the year, the volume of exports to Russia increased by 19.7%. Exports of services to Germany (second in terms of service exports) increased by 53%.
Transport and travel services comprised the largest share of the total exports of services to Russia and Germany (59.9 and 31.9% and 68.5 and 12.3% respectively).
The main Lithuania’s partner in the imports of services was Belarus. Over the year, the volume of imports from Belarus increased by 8.1%, while imports of services from Russia (second in terms of service imports) increased by 10.7%. The structure of services imported from Belarus and Russia differed just marginally; the largest shares of imports of services from both countries consisted of transport and travel services: from Belarus – 64.8 and 30.2%, from Russia – 69.3 and 17.8% respectively.
Structure of exports and imports of services, III quarter 2017
|
|
Exports |
Imports |
||||
|
EUR million |
share, % |
against III quarter 2016, % |
EUR million |
share, % |
against III quarter 2016, % |
|
|
Services, total |
2 227.9 |
100.0 |
22.5 |
1 328.7 |
100.0 |
10.2 |
|
Maintenance and repair services |
68.4 |
3.1 |
48.8 |
30.8 |
2.3 |
4.4 |
|
Transport services |
1 250.3 |
56.1 |
26.4 |
700.4 |
52.7 |
16.9 |
|
Passenger transport |
84.9 |
3.8 |
17.4 |
45.8 |
3.4 |
–17.2 |
|
Freight transport |
679.3 |
30.5 |
26.9 |
319.7 |
24.1 |
16.5 |
|
Other transport |
486.1 |
21.8 |
27.5 |
334.9 |
25.2 |
24.3 |
|
Travel |
361.7 |
16.2 |
3.6 |
276.6 |
20.8 |
0.5 |
|
Construction |
83.8 |
3.8 |
30.8 |
7.5 |
0.5 |
–23.2 |
|
Financial services |
31.2 |
1.4 |
19.4 |
34.3 |
2.6 |
7.0 |
|
Telecommunications, computer and information
services |
113.2 |
5.1 |
62.4 |
57.9 |
4.4 |
16.9 |
|
Telecommunications services |
21.6 |
1.0 |
48.1 |
21.0 |
1.6 |
–14.3 |
|
Computer services |
87.1 |
3.9 |
61.3 |
33.9 |
2.6 |
45.3 |
|
Information services |
4.5 |
0.2 |
3.9 times |
3.0 |
0.2 |
79.5 |
|
Other business services |
201.4 |
9.0 |
30.7 |
173.6 |
13.1 |
12.5 |
|
Research and development services |
10.2 |
0.5 |
28.4 |
1.4 |
0.1 |
–27.0 |
|
Professional and management consulting
services |
74.3 |
3.3 |
22.8 |
47.6 |
3.6 |
4.9 |
|
Technical, trade-related and other business
services |
116.9 |
5.2 |
36.4 |
124.6 |
9.4 |
16.4 |
|
Other services not elsewhere classified |
117.9 |
5.3 |
–2.6 |
47.6 |
3.6 |
–15.3 |
Source: Balance of payments data.
Detailed data on exports and imports of services are available on the website of the Bank of Lithuania (under External Statistics).


 «The Baltic Course» Is Sold and Stays in Business!
