
Agriculture, Analytics, EU – Baltic States, Latvia, Markets and Companies
International Internet Magazine. Baltic States news & analytics
Tuesday, 16.04.2024, 18:52
In 2016, average size of agricultural holding increased and their number – decreased in Latvia
 Print version
In 2016, there were 69.9 thsd
economically active holdings1 (with UAA larger than 1 ha or
standard output2 more by EUR 70 regardless of the area), which
managed 1930.8 ha of UAA. Compared to 2013 the total number of economically
active holdings in 2016 had decreased by 14.5%, while the UAA had grown by 2.8%.
The number of small agricultural holdings compared to 2013 had decreased
significantly - by 19.2% or 14.1 thsd.
Number of agricultural
holdings and UAA by size of holding*
|
|
Number of
holdings, thsd |
UAA, thsd
ha |
|||||||
|
2013 |
Share,% |
2016 |
Share,% |
2013 |
Share,% |
2016 |
Share,% |
|
|
|
All
holdings |
81.8 |
100 |
69.9 |
100 |
1877.7 |
100 |
1930.8 |
100 |
|
|
Of which: small |
73.6 |
90.0 |
59.5 |
85.1 |
683.0 |
36.4 |
557.3 |
28.9 |
|
|
medium-sized |
6.8 |
8.3 |
8.4 |
12.0 |
471.4 |
25.1 |
502.0 |
26.0 |
|
|
large |
1.4 |
1.7 |
2.0 |
2.9 |
723.3 |
38.5 |
871.5 |
45.1 |
|
*In the European Union
agricultural holdings are broken down into economic size groups: small holdings
- holdings with standard output2 (SO) up to EUR 14.9 thsd,
medium-sized holdings - SO from EUR 15 – EUR 99.9 thsd, and large holdings - SO over EUR 100 thsd.
The average size of
agricultural holding has risen from 37.4 ha in 2013 to 43.3 ha in 2016 or by
15.8%. Compared to 2013 the UAA on average per holding increased by 4.6 ha or
20%, reaching 27.6 ha in 2016. The average number of livestock per agricultural
holding also increased. One livestock-breeding agricultural holding was
breeding 18 cattle (of which 9 dairy cows), 31 pig, 35 sheep, 7 goats and 169
poultry
.
Main changes took place in
agricultural holdings breeding sheep and poultry – on average number of sheep
in one agricultural holding rose by 10 sheep or by 40% (from 25 sheep in 2013
to 35 sheep in 2016), but the number of poultry has reduced by 26.8% (from 231
poultry in 2013 to 169 poultry in 2016).
Average agricultural holding
in Latvia in 2016
|
|
All
holdings |
small |
medium-sized |
large |
||||
|
2013 |
2016 |
2013 |
2016 |
2013 |
2016 |
2013 |
2016 |
|
|
Total
area, ha |
37.4 |
43.3 |
21.5 |
22.9 |
92.7 |
85.0 |
589.2 |
470.0 |
|
UAA, ha |
24.9 |
29.1 |
11.1 |
10.9 |
95.0 |
61.6 |
507.7 |
433.8 |
|
UAA, ha |
23.0 |
27.6 |
9.3 |
9.4 |
69.8 |
60.0 |
502.6 |
430.9 |
|
Arable
land, ha |
14.7 |
18.4 |
3.0 |
2.7 |
48.2 |
38.7 |
455.6 |
396.9 |
|
Sown area,
ha |
14.0 |
17.6 |
2.8 |
2.5 |
45.4 |
36.6 |
436.0 |
393.3 |
|
Utilised meadows and pastures, ha |
7.0 |
8.2 |
5.1 |
5.6 |
20.2 |
20.6 |
42.0 |
32.2 |
|
Number of
cattle* |
14.3 |
18.0 |
4.3 |
4.3 |
32.5 |
29.3 |
215.4 |
190.1 |
|
Regular
labour force |
2.1 |
2.3 |
1.9 |
2.0 |
2.7 |
2.0 |
9.8 |
8.6 |
*average per breeding holding
Compared to 2013, in 2016
specialization structure of holdings has changed. Number of holdings
specialising in granivores (pigs and poultry) breeding has doubled – increased
from 2 thsd in 2013 to 4.5 thsd in 2016. Number of holdings specialising in
grazing livestock (without dairying) has grown by 24.6% – from 5.5 thsd to 6.9
thsd. Number of vegetable holdings has risen by 42.7% – from 655 to 935.
Number of granivores (pigs and poultry) has increased by 2.4 thsd or 119.4%.
In turn, number of holdings
specialising in permanent crops and mixed cropping has decreased by 45% (from 2
thsd to 1.1 thsd), number of dairying holdings – by 21% (from 2.6 thsd to 2.5
thsd) and number of field crops holdings (from 37.3 thsd to 29.9 thsd).
Agricultural holdings by type
of farming in 2016
(% of total number of holdings)
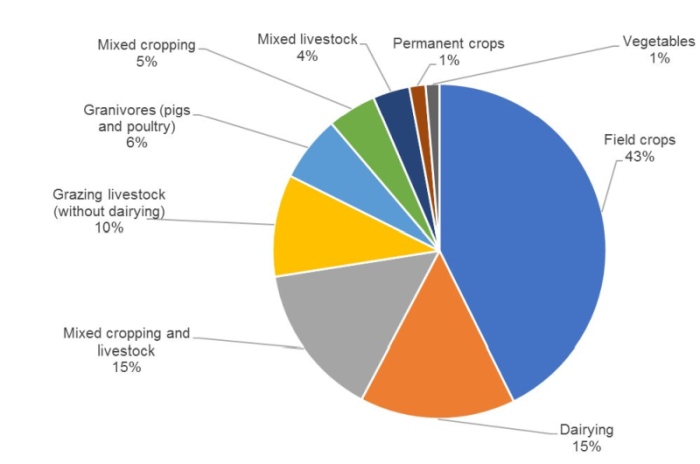
In 2016, 46.2% of all holdings
produced agricultural products only for own consumption, but 53.8% of holdings
sold their produced agricultural products, which is 9.9% more than in 2013. All
produced agricultural products were sold by 6% of holdings or 2.7% more than in
2013.
In 2016 regular labour force
in holdings comprised 162.6 thsd, which is 6.5% less than in 2013. 49.4 thsd
were employed in agriculture irregulary, which is 8.2% less than in 2013. Only
15.8% or 25.7 thsd of regular labour force were full-time employees, 84.2% or
136.9 thsd were part-time employees.
Agrucultural holdings in
Latvia mainly are family enterprises. In 2016, 68.9 thsd holdings or 98.5% of
the total number of agricultural holdings were owned by one natural person, of
which 45.6% of the farm owners were women. 0.7 thsd or 1% of agricultural
holdings were joint-property holdings. 69.3 thsd or 99% of agricultural
holdings managers were owners or their family members. 141 thsd or 86.7% of all
regular labour force of agricultural holdings were owners and their family
members.
More detailed results of Farm
Structure Survey 2016 will be available in the CSB database on 29.12.2017. In
Farm Structure Survey 2016 information on 30 thousand agricultural holdings was
obtained in sampling survey. Such survey is carried out once in three years in
all European Union and European Economic Area member countries.
1Economically active holding – agricultural holding producing agricultural
goods regardless of the volume of production and type of their use, or
preserving good agricultural and environmental conditions in the soil.
2Standard output –an indicator characterising the economic activity of an
agricultural holding, i.e., value acquired from one hectare of agricultural
crops or livestock head (unit), estimated at prices of the corresponding region
and expressed in EUR. Total standard output characterises the economic size of
a holding in monetary terms.


 «The Baltic Course» Is Sold and Stays in Business!
