
Analytics, Employment, Lithuania, Markets and Companies, Society
International Internet Magazine. Baltic States news & analytics
Thursday, 25.04.2024, 03:35
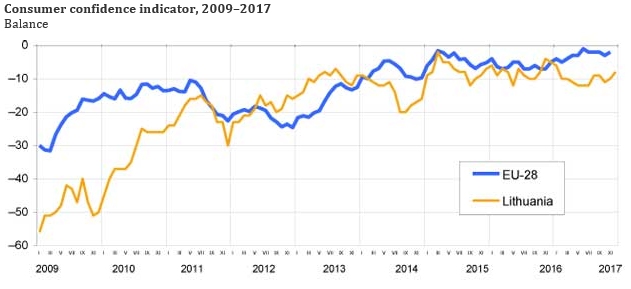
In December 2017, the consumer confidence indicator in Lithuania increased to – 8
 Print version
Against November, expectations of residents for making at least some
savings and changes in household financial and the country's economic situation
were more optimistic, while those for changes in unemployment figures – more
pessimistic.
Changes in the consumer confidence indicator and its components, balance
|
|
December |
November |
December2016 |
May 2001–December 2017 average |
Largest since May 2001 |
Smallest since May 2001 |
|
Consumer confidence indicator |
–8 |
–10 |
–5 |
−14.9 |
9 |
−56 |
|
Changes in the household’s financial situation in
the coming 12 months |
2 |
0 |
3 |
−4.1 |
13 |
−38 |
|
Changes in the country’s economic situation in the
coming 12 months |
–3 |
–6 |
6 |
−5.6 |
19 |
−57 |
|
Changes in the number of the unemployed in the coming
12 months |
4 |
3 |
3 |
11.4 |
82 |
−33 |
|
Probability of making savings in the coming 12
months |
–25 |
−33 |
–25 |
−38.3 |
−16 |
−54 |
In December, against November, percentage of those who expected to make at least some savings increased from 29 to 34%, while percentage of those who did not expect to make at least some savings decreased from 31 to 25%.
As regards the country’s economic situation, 26% of population expected the country’s economic situation to improve in the coming 12 months, 29% – expected it to deteriorate, while 42% – expected it to remain unchanged (in November, 24, 31 and 42% respectively).
Expectations of the residents for the changes in household’s financial situation also slightly improved: percentage of those expecting improvement in their household’s financial situation in the coming 12 months grew from 22 to 24%, while deterioration was expected by 17% (in November, 19%).
In December, against November, expectations of the residents for the changes in unemployment figures were slightly more pessimistic: the percentage of those expecting the number of the unemployed to increase in the coming 12 months grew from 29 to 31%, while 23% of population expected the number of the unemployed to decrease (in November, 25%).
Consumer confidence indicator in urban rural areas
In December, consumer confidence indicators in urban and rural areas did not differ. Against the previous month, in urban areas, the consumer confidence indicator grew by 1, in rural areas – 5 percentage points.
Expectations of both urban and rural population for the changes in the country’s economic and household financial situation as well as for making some savings in the coming 12 months were more optimistic.
Against November, opinion of urban population about changes in the number of the unemployed remained unchanged, while that of rural population was more pessimistic. The percentage of rural population expecting the number of the unemployed to increase in the coming 12 months grew from 30 to 37%.
Consumer confidence indicator, against the same period of the previous year
Over the year (December 2017, against December 2016), the consumer confidence indicator decreased by 3 percentage points. The decrease in the consumer confidence indicator was determined by more pessimistic assessment of the country’s economic situation: the percentage of population expecting deterioration in the country’s economic situation increased from 20 to 29%, while the percentage of those expecting improvement decreased from 33 to 26%.
Against the previous year, expectations of the residents for the changes in their household situation and in the number of the unemployed slightly deteriorated.
Compared to the previous year, opinion of the residents about possibility to make at least some savings in the coming 12 months remained unchanged.
Assessment of changes in the last 12 months and the current situation
In December, almost half (49%) of the population stated that their household financial situation in the last 12 months remained unchanged, 38% stated that it deteriorated, while 13% – that it improved (in November, 45, 39 and 16% respectively).
In December, the residents’ assessment of the changes in the country’s economic situation in the last 12 months was slightly better than in November: although the percentage of those who indicated an improvement in the country’s economic situation in the last 12 months remained unchanged (18%), yet the percentage of those who indicated significant deterioration in the country’s economic situation decreased from 13 to 10%.
As regards assessment of the current financial situation of the family, 35% of population stated that they made some savings, while each tenth resident indicated living on savings or borrowings (in November, 31 and 11% respectively).
In December, 28% of population intended to increase expenditure on such purchases as furniture or household appliances in the coming 12 months, 17% – expected to spend less than in the last 12 months (in November, 25 and 17% respectively).
The annex to the news release contains information on changes in the consumer confidence indicator and its components (answers to questions used to compile the indicator). Respective information on other EU countries is available on the European Commission’s website.
The consumer opinion survey is conducted on the 1st–15th days of each month by interviewing 1 200 individuals randomly sampled from the Population Register of the Republic of Lithuania. The consumer confidence indicator refers to the simple arithmetic mean of the balances of positive and negative answers to four questions (about changes in the financial situation of the household, the economic situation in the country, the number of the unemployed (with an opposite sign), and the probability of making savings in the coming 12 months).
The survey is partially funded by the EU.
The January consumer opinion survey results will be released on 29 January 2018.
For more information, see the Database of Indicators.
Table 1. Consumer confidence indicator, Balance
|
|
2016 |
2017 |
|||||||||||
|
XII |
I |
II |
III |
IV |
V |
VI |
VII |
VIII |
IX |
X |
XI |
XII |
|
|
Total population |
−5 |
−6 |
–10 |
–10 |
–11 |
–12 |
–12 |
–12 |
–9 |
–9 |
–11 |
–10 |
–8 |
|
Female |
−6 |
−10 |
–13 |
–14 |
–13 |
–15 |
–14 |
–15 |
–12 |
–13 |
–12 |
–13 |
–12 |
|
Male |
−3 |
−2 |
–7 |
–5 |
–9 |
–9 |
–9 |
–8 |
–7 |
–4 |
–9 |
–7 |
–2 |
|
Urban population |
−5 |
−6 |
–10 |
–9 |
–11 |
–11 |
–11 |
–11 |
–8 |
–9 |
–9 |
–9 |
–8 |
|
Rural population |
−5 |
−5 |
–11 |
–12 |
–12 |
–15 |
–13 |
–13 |
–12 |
–8 |
–13 |
–13 |
–8 |
Table 2. Opinion of the population about changes in the household’s
financial situation in the coming 12 months
Per cent
|
|
2016 |
2017 |
|||||||||||
|
XII |
I |
II |
III |
IV |
V |
VI |
VII |
VIII |
IX |
X |
XI |
XII |
|
|
Household’s financial situation in the coming
12 months will: |
|
|
|
|
|
|
|
|
|
|
|
|
|
|
significantly improve |
0 |
0 |
1 |
1 |
0 |
0 |
0 |
1 |
0 |
0 |
0 |
1 |
0 |
|
slightly improve |
23 |
20 |
18 |
20 |
17 |
18 |
18 |
16 |
17 |
18 |
19 |
21 |
24 |
|
remain unchanged |
55 |
57 |
57 |
55 |
57 |
55 |
55 |
60 |
60 |
59 |
55 |
51 |
52 |
|
slightly deteriorate |
13 |
14 |
17 |
15 |
17 |
16 |
19 |
15 |
16 |
16 |
16 |
16 |
15 |
|
significantly deteriorate |
2 |
2 |
2 |
3 |
3 |
3 |
3 |
3 |
2 |
3 |
2 |
3 |
2 |
|
Balance |
3 |
1 |
0 |
0 |
−3 |
−1 |
−3 |
–2 |
–2 |
–1 |
–1 |
0 |
2 |
Table 3. Opinion of the population about
changes in the country’s economic situation in the coming 12 months
Per
cent
|
|
2016 |
2017 |
|||||||||||
|
XII |
I |
II |
III |
IV |
V |
VI |
VII |
VIII |
IX |
X |
XI |
XII |
|
|
Country’s economic situation in the coming
12 months will: |
|
|
|
|
|
|
|
|
|
|
|
|
|
|
significantly improve |
0 |
1 |
0 |
0 |
1 |
0 |
0 |
0 |
0 |
0 |
0 |
1 |
1 |
|
slightly improve |
33 |
30 |
23 |
24 |
22 |
20 |
22 |
20 |
24 |
25 |
24 |
23 |
25 |
|
remain unchanged |
44 |
42 |
45 |
45 |
45 |
47 |
44 |
47 |
47 |
47 |
44 |
42 |
42 |
|
slightly deteriorate |
17 |
20 |
24 |
23 |
24 |
24 |
24 |
23 |
22 |
22 |
23 |
25 |
25 |
|
significantly deteriorate |
3 |
3 |
5 |
6 |
5 |
6 |
5 |
6 |
5 |
4 |
6 |
6 |
4 |
|
Balance |
6 |
2 |
–5 |
–5 |
–5 |
–8 |
–6 |
–7 |
−4 |
−2 |
–5 |
–6 |
–3 |
Table 4. Opinion of the population about changes in the number of the
unemployed in the coming 12 months
Per cent
|
|
2016 |
2017 |
|||||||||||
|
XII |
I |
II |
III |
IV |
V |
VI |
VII |
VIII |
IX |
X |
XI |
XII |
|
|
Number of the unemployed in the coming 12 months
will: |
|
|
|
|
|
|
|
|
|
|
|
|
|
|
significantly increase |
2 |
3 |
3 |
4 |
4 |
4 |
4 |
4 |
3 |
2 |
3 |
3 |
3 |
|
slightly increase |
27 |
26 |
31 |
34 |
26 |
30 |
29 |
31 |
28 |
28 |
29 |
26 |
28 |
|
remain unchanged |
42 |
44 |
41 |
38 |
43 |
42 |
41 |
41 |
44 |
45 |
42 |
40 |
42 |
|
slightly decrease |
23 |
21 |
20 |
20 |
22 |
20 |
21 |
18 |
20 |
20 |
19 |
24 |
22 |
|
significantly decrease |
2 |
1 |
1 |
1 |
1 |
2 |
1 |
1 |
1 |
2 |
2 |
1 |
1 |
|
Balance |
3 |
5 |
7 |
10 |
5 |
7 |
7 |
9 |
5 |
4 |
7 |
3 |
4 |
Table 5. Opinion of the population about the probability of making
savings in the coming 12 months
Per cent
|
|
2016 |
2017 |
|||||||||||
|
XII |
I |
II |
III |
IV |
V |
VI |
VII |
VIII |
IX |
X |
XI |
XII |
|
|
Probability of making savings in the coming
12 months: |
|
|
|
|
|
|
|
|
|
|
|
|
|
|
very likely |
2 |
3 |
2 |
3 |
2 |
1 |
2 |
2 |
1 |
2 |
2 |
2 |
2 |
|
quite likely |
33 |
34 |
31 |
31 |
29 |
30 |
28 |
32 |
32 |
31 |
29 |
27 |
32 |
|
rather unlikely |
36 |
34 |
39 |
35 |
33 |
35 |
38 |
34 |
40 |
36 |
39 |
36 |
38 |
|
absolutely unlikely |
26 |
26 |
26 |
27 |
32 |
30 |
28 |
29 |
24 |
28 |
28 |
31 |
25 |
|
Balance |
−25 |
−23 |
–28 |
–26 |
−32 |
−32 |
−31 |
–28 |
−27 |
–28 |
–30 |
–33 |
–25 |


 «The Baltic Course» Is Sold and Stays in Business!
