
Analytics, Financial Services, Latvia, Real Estate, Society
International Internet Magazine. Baltic States news & analytics
Thursday, 25.04.2024, 21:04
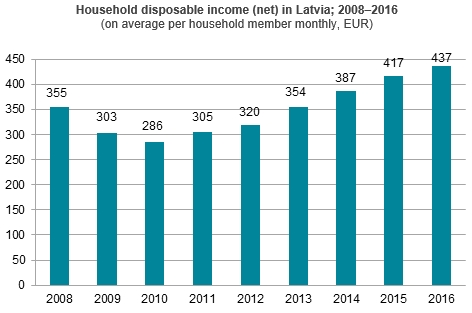
In 2016, household disposable income in Latvia increased by 4.9%
 Print version
In 2016,
household disposable income in urban areas increased by 4.2%, reaching
467 euros monthly. In rural areas, the indicator rose more rapidly –
by 6.7%, reaching 372 euros monthly. Regional breakdown indicates
notable differences in monthly household income per household member. The
largest growth in household disposable income was recorded in the Pierīga
region – of 7.2% (478 euros monthly), while the lowest increase was
observed in the Kurzeme region – of 1.8% (396 euros monthly). Income in Riga
grew by 3.7% (528 euros monthly), in Zemgale – by 4.9% (386 euros
monthly), in Latgale – by 5.6% (300 euros monthly), in Vidzeme – by 6.7%
(366 euros monthly).
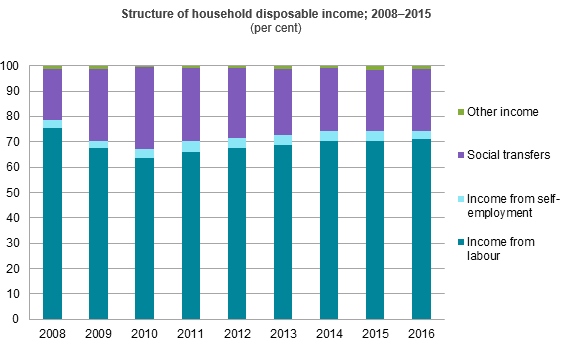
In 2016,
household income from labour per household member rose by 6.1% – from
293 euros a month in 2015 to 311 euros a month in 2016. Income from
social transfers2 (pensions, allowances and other budgetary
payments) per household member grew faster than income from labour for the
first time since the financial crisis – by 6.6% (from 101 euros a month in
2015 to 108 euros a month in 2016).
In 2016, the share
of income from labour amounted to 71.2% of the total disposable income (70.4%
in 2015), while the share of social transfers amounted to 24.7% (24.3% in
2015).
In 2016,
compared to 2015, the lowest increase in income was observed in the poorest
households (by 2.8% in households of the 1st quintile group and by 3.6% in
households of the 2nd quintile group). The income of the richest households,
belonging to the 5th quintile group, increased by 5.1% over the year. The
largest growth in income was recorded in households of the 4th and 3rd quintile
groups (by 6.4% and 5.7%, respectively).
Household disposable income by
quintile group; 2008–2016
|
Quintile
group3 |
2008 |
2009 |
2010 |
2011 |
2012 |
2013 |
2014 |
2015 |
2016 |
Income increase in 2016,
compared to 2015,% |
|
on average per household
member monthly, EUR |
||||||||||
|
1st
(poorest) |
112 |
100 |
97 |
105 |
112 |
125 |
135 |
150 |
154 |
2.8 |
|
2nd |
201 |
202 |
194 |
199 |
209 |
228 |
245 |
257 |
266 |
3.6 |
|
3rd |
281 |
259 |
257 |
260 |
272 |
295 |
317 |
340 |
360 |
5.7 |
|
4th |
411 |
355 |
338 |
352 |
372 |
413 |
449 |
483 |
514 |
6.4 |
|
5th
(richest) |
797 |
668 |
620 |
681 |
701 |
780 |
847 |
896 |
942 |
5.1 |
|
National
average |
355 |
303 |
286 |
305 |
320 |
354 |
387 |
417 |
437 |
4.9 |
The Gini coefficient of Latvia
did not change over the year (34.5%), while the income of the 20% of the
richest population was 6.3 times higher than that of the 20% of the
poorest population (6.2 times higher in 2015).
Income inequality indicators; 2011–2016
|
Indicator |
2011 |
2012 |
2013 |
2014 |
2015 |
2016 |
|
Gini
coefficient4 (%) |
35.7 |
35.2 |
35.5 |
35.4 |
34.5 |
34.5 |
|
Quintile share ratio (S80/S20)5 |
6.5 |
6.3 |
6.5 |
6.5 |
6.2 |
6.3 |
Compared to other European Union (EU) Member States6, the income
inequality level in Latvia remained high. According to the latest data, the
Gini coefficient of Latvia wat the fourth highest among EU Member States. The
coefficient was higher only in Bulgaria (38.3% in 2015), Lithuania (37.0% in
2015) and Romania (34.7% in 2015), while Spain had the same indicator as Latvia
(34.5% in 2016), and the average coefficient of EU amounted to 30.8% (in 2015).
The quintile share ratio was also one of the highest in the EU (7.9 in Bulgaria
(2015), 7.2 in Romania (2015), 7.1 in Lithuania (2015), 6.6 in Spain and in
Greece (2015), 6.3 in Italy (2015) and 6.3 in Latvia (2016), while the EU average
amounted to 5.2 (2015)).
Household
disposable income data source: survey on income and living conditions conducted
by the CSB in 2017 (EU-SILC – EU Statistics on Income and Living Conditions).
The survey covered 6 thousand households and 11.3 thousand
respondents aged 16 and over. CSB will collect data on household disposable
income in 2017 within the framework of the 2018 survey, and respondents
will have the possibility to fill in the questionnaire online.
More information
on the data of the survey conducted in 2017 is available in the Personal Income section of the CSB database.
Methodological explanations
1 Disposable income (net) is cash income from
labour, employee income in kind received by using a company car for private
needs estimated in cash, income or losses received from self-employment,
received pensions and benefits, regular material assistance from other households,
profit from interests of deposits, dividends, shares, income received by
children aged under 16, income from property rental, receipts from tax
adjustments from the State Revenue Service (for business activities, eligible
costs – education, medical treatment etc.).
2 Social transfers are pensions and benefits paid
by the State or municipality, child maintenance payments, scholarships, social
insurance benefits and compensations, including the ones paid by other
countries.
3 A quintile group is one fifth
(20%) of the number of the surveyed households grouped in increasing sequence
according to the disposable income per one household member. The bottom (first)
quintile includes one fifth of the households with the lowest income, while the
top (fifth) quintile comprises one fifth of the households with the highest
income level.
4 The Gini coefficient
characterises income inequality. It varies from 0 to 100. Gini coefficient
amounts to 0 if there is absolute equality of income (i.e., all population has
the same income), but the closer it gets to 100, the greater the inequality of
income.
5 Quintile share ratio (S80/S20)
is the ratio of total equivalised disposable income received by the 20% of the
country’s population with the highest equivalised disposable income (top
quintile) to that received by the 20% of the country’s population with the
lowest equivalised disposable income (bottom quintile).
6 Eurostat indicators on the
survey conducted in 2016 are available in the Eurostat database: Quintile share ratio, Gini coefficient, while national
data on the survey conducted in 2017 are available in the CSB database: Population and Social Processes.


 «The Baltic Course» Is Sold and Stays in Business!
