
Analytics, Employment, Labour-market, Lithuania, Markets and Companies, Wages
International Internet Magazine. Baltic States news & analytics
Tuesday, 16.04.2024, 21:52
In Q3, labour costs per hour in Lithuania increased by 7.9%
 Print version
Over a year, an increase in labour costs per hour worked, calendar adjusted, was observed in all economic activities, the largest – in financial and insurance activities (12.4%), information and communication (12.1%), real estate activities (10.5%), administrative and support service activities (10.3%), professional, scientific and technical activities, wholesale and retail trade; repair of motor vehicles and motorcycle (9.7% each).
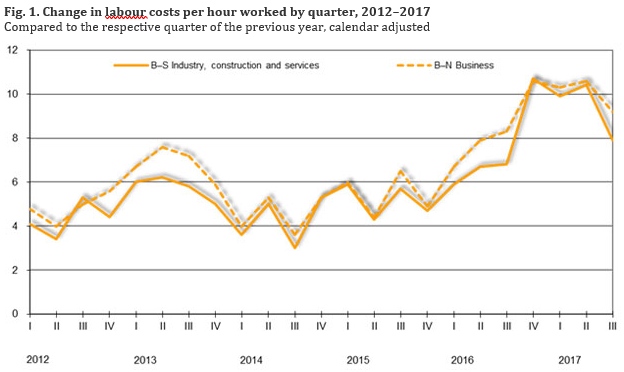
In III quarter 2017, against the same quarter of 2016, labour costs per hour worked, calendar adjusted, was determined by increased wages and salaries, severance pay and allowance in lieu of leave not take in certain economic activities, as well as other reasons.
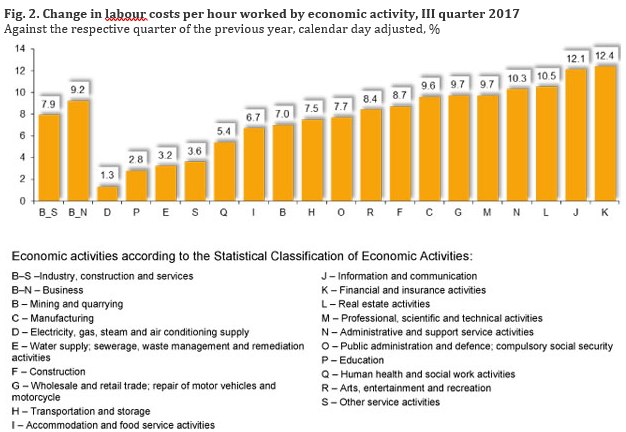
Table 1. Change in labour costs per hour worked by economic activity, by quarters, 2015–2017, compared to the respective quarter of the previous year, calendar adjusted, %
|
|
2015 |
2016 |
2017 |
||||||||
|
I |
II |
III |
IV |
I |
II |
III |
IV |
I |
II |
III |
|
|
B–S |
5.9 |
4.3 |
5.7 |
4.7 |
5.9 |
6.7 |
6.8 |
10.7 |
9.9 |
10.4 |
7.9 |
|
B–N |
6.0 |
4.4 |
6.5 |
4.9 |
6.7 |
7.9 |
8.3 |
10.6 |
10.3 |
10.6 |
9.2 |
|
B |
2.2 |
3.9 |
6.3 |
9.2 |
7.2 |
6.6 |
6.6 |
2.9 |
6.8 |
6.9 |
7.0 |
|
C |
7.8 |
5.7 |
8.4 |
7.7 |
8.2 |
9.3 |
9.5 |
11.4 |
10.5 |
10.0 |
9.6 |
|
D |
2.4 |
4.6 |
3.0 |
6.5 |
6.8 |
1.4 |
4.4 |
0.8 |
7.3 |
8.5 |
1.3 |
|
E |
5.9 |
3.6 |
6.1 |
3.9 |
5.8 |
8.0 |
5.7 |
8.8 |
3.8 |
5.2 |
3.2 |
|
F |
5.2 |
–0.1 |
1.9 |
2.5 |
2.1 |
8.4 |
9.5 |
8.7 |
13.9 |
9.8 |
8.7 |
|
G |
4.1 |
4.6 |
6.1 |
4.5 |
7.6 |
7.7 |
8.8 |
11.0 |
9.8 |
12.6 |
9.7 |
|
H |
5.5 |
1.9 |
3.8 |
0.9 |
4.1 |
9.4 |
10.1 |
12.3 |
13.2 |
9.2 |
7.5 |
|
I |
8.0 |
6.9 |
10.3 |
9.4 |
11.4 |
13.9 |
13.5 |
15.7 |
15.2 |
7.7 |
6.7 |
|
J |
6.3 |
3.0 |
6.9 |
4.3 |
9.4 |
8.0 |
5.3 |
11.4 |
8.1 |
14.0 |
12.1 |
|
K |
5.2 |
6.7 |
9.5 |
7.5 |
7.5 |
6.4 |
4.1 |
9.4 |
3.2 |
7.2 |
12.4 |
|
L |
5.4 |
6.0 |
5.6 |
5.0 |
10.3 |
1.5 |
1.5 |
5.9 |
1.7 |
8.9 |
10.5 |
|
M |
6.9 |
7.2 |
9.2 |
6.7 |
5.1 |
3.7 |
5.4 |
7.2 |
10.4 |
12.7 |
9.7 |
|
N |
9.8 |
8.2 |
10.2 |
4.0 |
8.3 |
6.2 |
6.4 |
12.3 |
7.4 |
10.8 |
10.3 |
|
O |
4.6 |
0.1 |
1.3 |
1.0 |
1.3 |
4.0 |
6.2 |
10.7 |
11.4 |
10.8 |
7.7 |
|
P |
6.8 |
5.8 |
5.6 |
4.8 |
3.0 |
2.2 |
–0.4 |
8.2 |
5.3 |
8.6 |
2.8 |
|
Q |
4.3 |
6.0 |
5.6 |
5.7 |
5.2 |
3.2 |
9.1 |
13.5 |
10.7 |
10.9 |
5.4 |
|
R |
9.8 |
9.0 |
9.0 |
6.1 |
9.1 |
7.9 |
5.8 |
9.7 |
9.9 |
12.1 |
8.4 |
|
S |
5.3 |
2.9 |
10.2 |
8.1 |
7.8 |
9.7 |
8.7 |
13.5 |
6.6 |
5.1 |
3.6 |
Over a year, gross earnings and remuneration in kind per hour worked in industrial, construction and service enterprises, calendar adjusted, increased by 7.2%, of which in business enterprises – 8%. Over a year, other labour costs (employers’ social contributions), calendar adjusted, increased by 9.7%, of which in business enterprises – 12%.
Over a year, calendar adjusted, the fastest growth in gross earnings and remuneration in kind per hour worked was observed in information and communication activities (12.9%), financial and insurance activities (9.8%), real estate activities (9.5%), professional, scientific and technical activities (9.3%), wholesale and retail trade; repair of motor vehicles and motorcycle (9.2%), while a decrease was observed for electricity, gas, steam and air conditioning supply (0.7%).
In III quarter 2017, against the respective quarter of 2016, an increase in other labour costs, calendar adjusted, was observed in all economic activities. The largest increase in other labour costs per hour worked was observed for financial and insurance activities (19%), administrative and support service activities (15.9%), transportation and storage (15.6%).
More rapid growth of other labour costs, compared to gross earnings and remuneration in kind, was influenced by increased severance pay and compensations in certain economic activities, as well as other reasons.
Table 2. Change in labour costs per hour worked by labour cost elements and economic activity, III quarter 2015–2017, compared to the respective quarter of the previous year, calendar adjusted, %
|
|
III quarter 2015 |
III quarter 2016 |
III quarter 2017 |
||||||
|
Labour costs |
of which |
Labour costs |
of which |
Labour costs |
of which |
||||
|
gross earnings
and remuneration in kind |
other labour costs |
gross earnings
and remuneration in kind |
other labour costs |
gross earnings
and remuneration in kind |
other labour costs |
||||
|
B–S |
5.7 |
6.0 |
5.1 |
6.8 |
6.7 |
7.1 |
7.9 |
7.2 |
9.7 |
|
B–N |
6.5 |
7.1 |
5.1 |
8.3 |
8.3 |
8.4 |
9.2 |
8.0 |
12.0 |
|
B |
6.3 |
5.7 |
8.1 |
6.6 |
7.6 |
3.9 |
7.0 |
7.3 |
6.5 |
|
C |
8.4 |
8.3 |
8.7 |
9.5 |
9.8 |
8.5 |
9.6 |
9.0 |
11.4 |
|
D |
3.0 |
2.9 |
3.4 |
4.4 |
6.3 |
–0.6 |
1.3 |
–0.7 |
7.1 |
|
E |
6.1 |
5.1 |
9.1 |
5.7 |
4.6 |
9.0 |
3.2 |
3.7 |
1.8 |
|
F |
1.9 |
5.7 |
–6.1 |
9.5 |
8.0 |
12.8 |
8.7 |
8.5 |
9.1 |
|
G |
6.1 |
5.8 |
7.2 |
8.8 |
9.1 |
7.9 |
9.7 |
9.2 |
11.1 |
|
H |
3.8 |
6.4 |
–0.1 |
10.1 |
9.0 |
11.9 |
7.5 |
2.2 |
15.6 |
|
I |
10.3 |
10.3 |
10.3 |
13.5 |
13.7 |
13.0 |
6.7 |
6.2 |
8.1 |
|
J |
6.9 |
6.3 |
8.8 |
5.3 |
6.0 |
3.5 |
12.1 |
12.9 |
9.8 |
|
K |
9.5 |
8.7 |
11.7 |
4.1 |
3.9 |
4.4 |
12.4 |
9.8 |
19.0 |
|
L |
5.6 |
5.1 |
7.1 |
1.5 |
2.5 |
–1.4 |
10.5 |
9.5 |
13.3 |
|
M |
9.2 |
9.2 |
9.2 |
5.4 |
5.8 |
4.3 |
9.7 |
9.3 |
10.9 |
|
N |
10.2 |
10.2 |
10.1 |
6.4 |
6.4 |
6.4 |
10.3 |
8.0 |
15.9 |
|
O |
1.3 |
1.0 |
2.4 |
6.2 |
6.2 |
6.0 |
7.7 |
8.1 |
6.5 |
|
P |
5.6 |
5.3 |
6.5 |
–0.4 |
–0.8 |
0.6 |
2.8 |
3.4 |
1.0 |
|
Q |
5.6 |
5.3 |
6.3 |
9.1 |
9.1 |
9.1 |
5.4 |
5.3 |
5.6 |
|
R |
9.0 |
8.9 |
9.5 |
5.8 |
5.4 |
6.7 |
8.4 |
8.8 |
7.3 |
|
S |
10.2 |
10.6 |
9.0 |
8.7 |
9.0 |
7.7 |
3.6 |
3.1 |
4.8 |
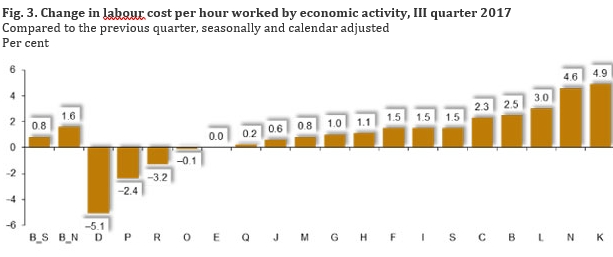
In III quarter 2017, against II quarter 2017, labour costs per hour worked in industrial, construction and service enterprises (including individual enterprises), seasonally and calendar adjusted, increased by 0.8%, of which in business enterprises – 1.6%.
The largest increase in labour costs over a quarter, seasonally and calendar adjusted, was observed in enterprises engaged in financial and insurance activities (4.9%), administrative and support service activities (4.6%), while decrease – in electricity, gas, steam and air conditioning supply (5.1%), education (2.4%), arts, entertainment and recreation (1.3%), public administration and defence; compulsory social security (0.1%). Labour costs per hour worked in water supply, sewerage, waste management and remediation activities remained unchanged.
Table 3. Labour costs per hour worked by economic activity, 2015–2017, by quarter, EUR
|
|
2015 |
2016 |
2017 |
||||||||
|
I |
II |
III |
IV |
I |
II |
III |
IV |
I |
II |
III |
|
|
B–S |
6.35 |
6.54 |
7.00 |
6.61 |
6.75 |
6.82 |
7.60 |
7.31 |
7.16 |
7.62 |
8.30 |
|
B–N |
6.38 |
6.46 |
6.64 |
6.62 |
6.84 |
6.84 |
7.28 |
7.32 |
7.31 |
7.65 |
8.03 |
|
B |
7.62 |
7.32 |
7.49 |
9.23 |
8.17 |
7.69 |
8.04 |
9.50 |
8.55 |
8.28 |
8.68 |
|
C |
6.20 |
6.36 |
6.65 |
6.60 |
6.65 |
6.80 |
7.36 |
7.36 |
7.16 |
7.57 |
8.17 |
|
D |
7.79 |
9.30 |
9.57 |
8.82 |
8.33 |
9.25 |
10.10 |
8.89 |
8.88 |
10.15 |
10.26 |
|
E |
6.32 |
6.52 |
6.87 |
6.53 |
6.69 |
6.95 |
7.31 |
7.10 |
6.79 |
7.35 |
7.63 |
|
F |
6.32 |
5.88 |
5.96 |
6.28 |
6.64 |
6.29 |
6.56 |
6.83 |
7.23 |
6.96 |
7.16 |
|
G |
5.53 |
5.66 |
5.85 |
5.76 |
5.96 |
6.01 |
6.41 |
6.40 |
6.40 |
6.81 |
7.08 |
|
H |
7.13 |
7.23 |
7.34 |
7.34 |
7.51 |
7.73 |
8.18 |
8.24 |
8.16 |
8.55 |
8.86 |
|
I |
3.82 |
3.93 |
4.02 |
4.07 |
4.30 |
4.32 |
4.65 |
4.71 |
4.69 |
4.74 |
5.01 |
|
J |
10.50 |
10.61 |
11.14 |
10.57 |
11.55 |
11.19 |
11.87 |
11.77 |
12.03 |
12.90 |
13.47 |
|
K |
12.51 |
12.44 |
12.68 |
11.87 |
13.33 |
12.99 |
13.32 |
12.98 |
13.43 |
14.07 |
15.12 |
|
L |
5.59 |
5.90 |
5.91 |
5.83 |
6.28 |
5.80 |
6.09 |
6.18 |
6.03 |
6.42 |
6.85 |
|
M |
7.62 |
7.90 |
8.27 |
8.06 |
7.96 |
7.99 |
8.82 |
8.64 |
8.55 |
9.11 |
9.77 |
|
N |
5.28 |
5.41 |
5.54 |
5.42 |
5.74 |
5.57 |
5.98 |
6.09 |
5.91 |
6.26 |
6.67 |
|
O |
7.88 |
8.31 |
9.04 |
8.12 |
8.20 |
8.48 |
9.70 |
8.99 |
8.63 |
9.48 |
10.55 |
|
P |
5.89 |
6.36 |
9.32 |
6.14 |
6.08 |
6.35 |
9.38 |
6.64 |
6.17 |
6.97 |
9.76 |
|
Q |
5.90 |
6.45 |
6.87 |
6.33 |
6.26 |
6.47 |
7.57 |
7.19 |
6.63 |
7.30 |
8.13 |
|
R |
4.62 |
4.87 |
5.68 |
5.17 |
5.08 |
5.14 |
6.07 |
5.67 |
5.36 |
5.82 |
6.63 |
|
S |
5.03 |
5.13 |
5.37 |
5.23 |
5.40 |
5.49 |
5.91 |
5.93 |
5.54 |
5.83 |
6.21 |
Concepts
Gross earnings and remuneration in kind refers to remuneration in cash covering the basic wage and bonuses, payable by the employer to the employee directly, including state social insurance contributions and individual income tax payable by the employee, as well as remuneration in kind (e.g. all goods and services made available to employees through the enterprise, staff housing, presents and other employers’ expenditure in kind).
Labour costs are the total expenditure borne by an employer in order to employ workers. They include: gross remuneration in cash and in kind, employers’ social contributions, vocational training costs, other expenditure incurred in order to employ workers. Vocational training costs, other expenditure incurred in order to employ workers and subsidies received by the employer are excluded from the calculation of the labour cost index.
Labour cost index is a relative indicator reflecting the change in labour costs per hour worked over a certain period of time.
Other labour costs refers to employers’ social contributions (allowances for sick leave paid by the employer from his own funds; guaranteed remuneration in the event of short-time working, payments to employees leaving the enterprise; family social benefits and others similar costs), except for subsidies received by the employer.
More information on the issue is available in the Database of Indicators of Statistics Lithuania.


 «The Baltic Course» Is Sold and Stays in Business!
