
Analytics, Economics, GDP, Lithuania, Markets and Companies
International Internet Magazine. Baltic States news & analytics
Thursday, 18.04.2024, 18:46
GDP increased only in Vilnius, Kaunas and Šiauliai counties in Lithuania in 2016
 Print version
The largest per-capita GDP, as usual, was recorded in Vilnius county. Vilnius county was also the only county where per-capita GDP exceeded the national average and made up 148.1% of the national average. Per-capita GDP in Klaipėda and Kaunas counties made up 98.5 and 99.9% respectively. In the rest of the counties, per-capita GDP was also below the national average. The smallest per-capita GDP was recorded in Tauragė county (54.5%).
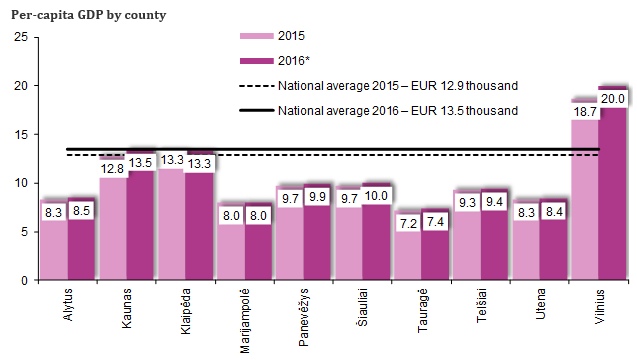
In 2016, the nominal per-capita GDP increased the most in Vilnius (6.9%), Kaunas (5.1%) and Šiauliai (3.4%) counties, while the country’s nominal GDP per capita grew by 4.6%.
In 2016, in terms of GDP per capita, the gap between Vilnius and other regions increased: in Vilnius county, this indicator exceeded those of Alytus, Marijampolė, Panevėžys, Utena, Šiauliai, Telšiai and Tauragė counties more than twice.
GDP and population by county in 2016*
|
|
National |
Counties |
|||||||||
|
Alytus |
Kaunas |
Klaipėda |
Marijampolė |
Panevėžys |
Šiauliai |
Tauragė |
Telšiai |
Utena |
Vilnius |
||
|
GDP, EUR million |
38 668.3 |
1 213.5 |
7 723.6 |
4 282.4 |
1 177.2 |
2 263.3 |
2 737.9 |
734.7 |
1 315.3 |
1 141.7 |
16 078.7 |
|
Proportion of
GDP, against the country’s GDP,% |
100.0 |
3.1 |
20.0 |
11.1 |
3.0 |
5.9 |
7.1 |
1.9 |
3.4 |
3.0 |
41.6 |
|
GDP per capita,
EUR thousand |
13.5 |
8.5 |
13.5 |
13.3 |
8.0 |
9.9 |
10.0 |
7.4 |
9.4 |
8.4 |
20.0 |
|
Per-capita GDP,
against the national average,% |
100.0 |
62.8 |
99.9 |
98.5 |
59.3 |
73.6 |
74.3 |
54.5 |
69.9 |
62.6 |
148.1 |
|
Average annual population, thousand |
2 868.2 |
143.4 |
573.6 |
322.6 |
147.2 |
228.0 |
273.4 |
99.9 |
139.5 |
135.3 |
805.3 |
__________________
* Provisional data
Based on more comprehensive data, Statistics Lithuania revised provisional GDP data for 2015 by county.
* Provisional data
For more information, see the Database of Indicators.


 «The Baltic Course» Is Sold and Stays in Business!
