
Analytics, Employment, EU – Baltic States, Labour-market, Latvia, Markets and Companies
International Internet Magazine. Baltic States news & analytics
Tuesday, 23.04.2024, 19:04
In Q3, Latvian unemployment rate fell by 0.4 percentage points
 Print version
In the 3rd quarter
of 2017, 84.1 thousand people aged 15–74 were unemployed, which is
10.3 thousand fewer than a year ago and 2.5 thousand fewer than in
the previous quarter.
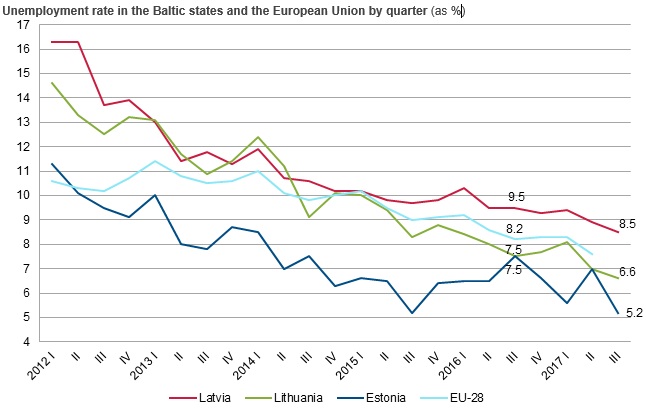
Latvian unemployment rate has
been exceeding the European Union (EU) average indicator since the end of the 3rd quarter
of 2008 (except for the 1st quarter of 2015 when both rates
were equal). In the 2nd quarter of 2017, Latvian unemployment
rate (8.9%) was 1.3 percentage points above the EU average (7.6%). In the
3rd quarter of 2017, Latvian unemployment rate still was the
highest among the Baltic states (5.2% in Estonia and 6.6% in Lithuania).
Data source: Eurostat
database, data on the 3rd quarter of 2017 – Labour Force
Surveys of Latvia, Lithuania and Estonia.
Long-term unemployed persons
In the 3rd quarter
of 2017, the share of long-term unemployed persons, i.e., those who have been
without work for 12 months or longer, in the total number of unemployed persons
declined by 1.5 percentage points – from 41.6% in the 3rd quarter
of 2016 to 40.1% in the 3rd quarter of 2017. Over the year, the
number of long-term unemployed persons reduced by 5.7 thousand, and in the
3rd quarter of 2017 it constituted 33.6 thousand.
Youth unemployment
In the 3rd quarter
of 2017, youth unemployment rate constituted 17.6%, which is
1.7 percentage points lower than a year ago and 1.1 percentage points
higher than in the 2nd quarter of 2017. During the year,
the number of young unemployed persons fell by 1.3 thousand, and, compared
to the 2nd quarter of 2017, it went up by 0.5 thousand.
In the 3rd quarter
of 2017, out of the total number of unemployed persons, 13.3 thousand or
15.8% were young people aged 15–24. Their share in the total number of
unemployed persons rose by 0.3 percentage points over the year and by
1.1 percentage points compared to the 2nd quarter of 2017.
In the 3rd quarter
of 2017, 42.4% of all young people were active, i.e., employed or actively
seeking a job (unemployed), while 57.6% of young people were inactive (mainly
studying and not seeking a job).
Inactive population
In the 3rd quarter
of 2017, 30.5% or 433.0 thousand people aged 15–74 were inactive. i.e.,
were neither employed nor actively seeking a job. Compared to the 2nd quarter
of 2017, the inactive population declined by 14.1 thousand or 3.2%, while
compared to the 3rd quarter of 2016 – by 24.9 thousand or
5.4%.
In the 3rd quarter
of 2017, 19.5 thousand people or 4.5% of the inactive population were
discouraged to find a job (in the 3rd quarter of 2016 the
indicator constituted 4.2% and in the 2nd quarter of 2017 – 3.7%).
In the 3rd quarter
of 2017, the Labour Force Survey covered 4.1 thousand households, in which 7.6
thousand persons aged 15–74 were interviewed.
More employment statistics is
available in the CSB database section Employment and Unemployment – Key Indicators. Results of the Labour Force Survey are published in the CSB database
section Employment and Unemployment.
As of the 3rd quarter
of 2017, the quarterly indicators on unemployed persons by main sector of
economic activity (NACE Rev.2) in the last job will not be published; only the
annual statistics will be published.


 «The Baltic Course» Is Sold and Stays in Business!
