
Analytics, Inflation, Lithuania, Markets and Companies
International Internet Magazine. Baltic States news & analytics
Thursday, 25.04.2024, 11:37
Average annual harmonized inflation in Lithuania stood at 2.7% in August
 Print version
In August 2017, annual inflation (August 2017, against August 2016) calculated based on the HICP stood at 4.6% and was by 0.2 percentage points higher than the CPI-based one.
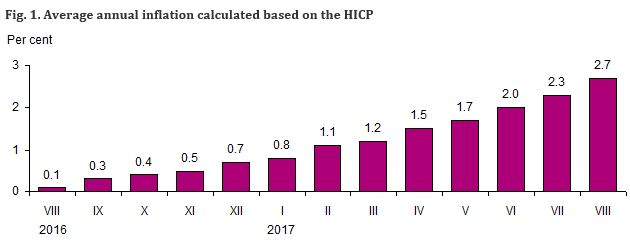
In August 2017, against July, the overall change in prices for consumer goods and services calculated based on the HICP and CPI was close to zero.
Table 1. Rates of change in prices for consumer goods and services calculated based on the HICP, August 2017
|
COICOP/HICP1 divisions
of consumer goods and services |
Relative share (weight) in total consumption
expenditure, ‰ |
Price growth, drop (–), % |
||
|
August 2017, against |
Average annual |
|||
|
July 2017 |
August 2016 |
|||
|
Consumption goods and services |
1 000.0 |
0.0 |
4.6 |
2.7 |
|
Food products
and non-alcoholic beverages |
206.2 |
0.0 |
4.0 |
2.2 |
|
Alcoholic
beverages and tobacco products |
83.9 |
0.2 |
12.2 |
8.4 |
|
Clothing and footwear |
71.1 |
–1.6 |
1.3 |
0.1 |
|
Housing,
water, electricity, gas and other fuels |
101.5 |
0.1 |
3.7 |
–0.3 |
|
Furnishings,
household equipment and routine maintenance |
75.6 |
–0.5 |
1.2 |
1.2 |
|
Health care |
53.9 |
–0.6 |
–0.3 |
1.2 |
|
Transport |
155.2 |
0.5 |
6.6 |
3.8 |
|
Communications |
27.7 |
0.0 |
1.0 |
–3.3 |
|
Recreation and culture |
78.2 |
–0.1 |
3.2 |
2.0 |
|
Education |
12.9 |
0.0 |
2.1 |
2.6 |
|
Hotels, cafes and restaurants |
53.7 |
0.7 |
7.6 |
6.5 |
|
Miscellaneous goods and services |
80.1 |
0.1 |
5.3 |
4.6 |
1 Classification of Individual Consumption by Purpose adapted for the needs of Harmonized Index of Consumer Prices (COICOP/HICP).
For the calculation of annual and average annual inflation, monthly price changes and price changes for other periods, the HICPs calculated based on the 2015 index base period (2015 = 100) accurate to two decimal places are used. Price indices are published accurate to two decimal places, inflation and price changes – to one decimal place.
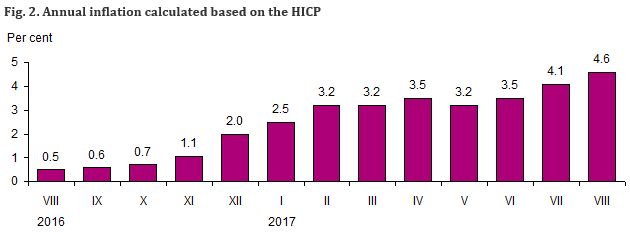
Table 2. COICOP/HICP classes of consumer goods and services whose rates of change in prices had the biggest impact on the overall price change
|
COICOP/HICP classes of consumer goods and services |
Relative share (weight) in total consumption
expenditure, ‰ |
Price growth, drop (–), % |
Impact, percentage points |
|
August 2017, against July |
|||
|
Milk and milk
products, cheese, eggs |
40.3 |
2.7 |
+0.109 |
|
Tobacco products |
28.3 |
1.7 |
+0.049 |
|
Cars |
22.7 |
1.7 |
+0.037 |
|
Oil and fats |
10.3 |
3.2 |
+0.033 |
|
Passenger transport by road |
12.7 |
2.2 |
+0.027 |
|
Accommodation services |
16.1 |
1.2 |
+0.020 |
|
Heat energy |
20.3 |
–1.1 |
–0.022 |
|
Sugar, jam,
honey, chocolate and confectionery |
14.6 |
–2.0 |
–0.030 |
|
Pharmaceuticals |
27.5 |
–1.3 |
–0.033 |
|
Footwear |
18.8 |
–2.5 |
–0.041 |
|
Clothing |
47.9 |
–1.5 |
–0.064 |
|
Vegetables |
16.8 |
–8.4 |
–0.121 |
|
August 2017, against August 2016 |
|||
|
Beer |
19.2 |
30.4 |
+0.567 |
|
Passenger transport by air |
9.3 |
33.3 |
+0.487 |
|
Milk and milk
products, cheese, eggs |
40.3 |
10.7 |
+0.406 |
|
Fuels and lubricants |
66.4 |
5.9 |
+0.372 |
|
Catering
services of restaurants, cafés and the like |
28.9 |
9.3 |
+0.262 |
|
Tobacco products |
28.3 |
8.2 |
+0.229 |
|
Information processing equipment |
5.0 |
–0.5 |
–0.003 |
|
Cars |
22.7 |
–0.5 |
–0.012 |
|
Telephone equipment |
3.2 |
–6.9 |
–0.017 |
|
Equipment for
the reception, recording and reproduction of sound and pictures |
9.2 |
–3.7 |
–0.035 |
|
Electricity |
15.1 |
–4.9 |
–0.075 |
|
Pharmaceuticals |
27.5 |
–4.3 |
–0.155 |
The overall change in consumer prices is influenced not only by the size of the price change for a certain product but also by the relative share (weight) of expenditure on that product in the total consumption expenditure.
Differences between the HICP and the CPI
Purpose. The HICP is an instrument for measuring inflation in the EU and making international comparisons, as well as for the compilation of the European index of consumer prices (covering 28 EU member states), Monetary Union index of consumer prices (covering 19 EU member states belonging to the euro area: Austria, Belgium, Cyprus, Estonia, Finland, France, Germany, Greece, Ireland, Italy, Latvia, Lithuania, Luxembourg, Malta, the Netherlands, Portugal, Slovakia, Slovenia and Spain), and the European Economic Area index of consumer prices (covering 28 EU member states, Iceland and Norway). The extent to which a country fulfils the price stability criterion established in Article 140 of the Treaty on the Functioning of the European Union is measured taking into consideration the inflation rate calculated based on the HICP. The CPI is used to measure the inflation rate in the country; it is the key instrument for indexation.
Coverage. The HICP, alongside consumption expenditure incurred by the residents of the country, covers consumption expenditure incurred by non-residents and visitors from abroad within the economic territory of the country. The CPI covers consumption expenditure incurred only by the residents of the country within the economic territory of the country. The HICP does not cover household expenditure on games of chance and financial intermediation services, while the CPI does cover them.
Weights. Due to a different coverage of consumption expenditure, weighting systems used for the HICP and CPI compilation differ. This is the primary factor leading to differences in index values.
Classification. For the calculation of the CPI, the Classification of Individual Consumption by Purpose (COICOP) is used. The Classification of Individual Consumption by Purpose adapted to the needs of HICPs has been adjusted for the calculation of the HICP.
A news release on the September 2017 inflation calculated based on the HICP is due on 10 October 2017.
For more information on the issue, please see the Database of Indicators and Eurostat’s website.


 «The Baltic Course» Is Sold and Stays in Business!
