
Analytics, Employment, EU – Baltic States, Financial Services, Latvia, Markets and Companies, Wages
International Internet Magazine. Baltic States news & analytics
Thursday, 25.04.2024, 21:08
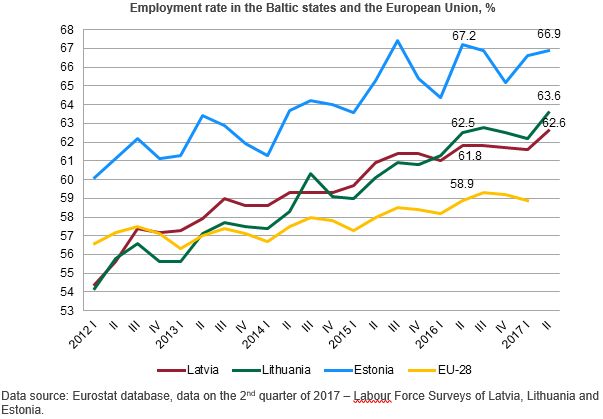
62.6% Latvia’s population were employed in Q2
 Print version
In the 2nd quarter
of 2017, Latvian employment rate (62.6%) was the highest recorded since the 2nd quarter
of 2008 (63.1%).
In the 2nd quarter
of 2017, in Latvia there were 891.7 thousand employed persons aged 15–74.
Compared to the previous quarter, in the 2nd quarter of 2017
the employment rate rose by 1 percentage point, while the number of
employed persons by 9.2 thousand. The most significant increase in
the number of employed persons was recorded in manufacturing, education, arts,
entertainment and recreation, accommodation and food service activities, as
well as administrative and support service activities.
Nonetheless
since the end of 2012 Latvian employment rate has been exceeding the European
Union (EU) average (58.9% in the 1st quarter of 2017), in the 2nd quarter
of 2017 it was the lowest rate recorded among the Baltic states (66.9% in
Estonia and 63.6% in Lithuania).
In the 2nd quarter
of 2017, the employment rate among young people (aged 15–24) constituted 35.8%,
which is 3.6 percentage points higher than in the corresponding period a year
before. The number of employed young people accounted for
64.6 thousand (63.0 thousand in the 2nd quarter of 2016).
In the 2nd quarter
of 2017, persons employed in the main job worked on average 37.7 hours per week
– 0.8 hours fewer than in the 2nd quarter of 2016.
The Labour Force
Survey data show that, compared to the 2nd quarter of 2016, in
the 2nd quarter of 2017 the share of employees receiving less
than 450.00 euros monthly (after taxes) reduced to 39.2% (a drop of 5.9
percentage points). The proportion of employees receiving minimum monthly wage
or less constituted 148.2 thousand or 18.9% (reduction of
2.0 percentage points over the year).The share of employees receiving
450.01–700 euros monthly rose by 1.7 percentage points (31.8% in the 2nd quarter
of 2017) and that of employees receiving 700.01–700 euros monthly increased by
2.4 percentage points (19.7% in the 2nd quarter of 2017).In its
turn, the proportion of employees receiving more than 1400 euros monthly grew
by 1.2 percentage points (3.7% in the 2nd quarter of 2017).Wage
or salary of 3.4% of employees was not calculated or paid, while 2.2% did not
indicate the size of earnings thereof.
Employees by monthly net (after taxes) wages and salaries in the main job, %
|
|
2nd quarter of 2016 |
1st quarter of 2017 |
2nd quarter of 2017 |
|
Employees |
100.0 |
100.0 |
100.0 |
|
Up to
450.00 euros |
45.1 |
41.9 |
39.2 |
|
of which employees receiving minimum
monthly wage or less |
20.9 |
21.4 |
18.9 |
|
450.01–700.00 euros |
30.1 |
31.6 |
31.8 |
|
700.01–1400.00 euros |
17.3 |
18.2 |
19.7 |
|
1400.01 euros
and more |
2.5 |
3.8 |
3.7 |
|
Was not calculated or paid |
3.5 |
2.3 |
3.4 |
|
Not
specified |
1.5 |
2.2 |
2.2 |
Data source: Latvian
Labour Force Survey
In the 2nd quarter
of 2017, the Labour Force Survey covered 4.1 thousand households, in which 7.6
thousand persons aged 15–74 were interviewed.
More information
on employment statistics is available in the CSB database section Employment and Unemployment – Key Indicators. Results of the Labour Force Survey are published in the CSB database
section Employment and Unemployment.


 «The Baltic Course» Is Sold and Stays in Business!
