
Analytics, Baltic, Financial Services, Society
International Internet Magazine. Baltic States news & analytics
Sunday, 24.05.2026, 18:00
In 2016, 21.9% Lithuania’s population were living below the at-risk-of-poverty threshold
 Print version
In urban areas, the proportion of persons with disposable income below the at-risk-of-poverty threshold stood at 15.6% (in five major cities – at 11.6, in other towns – at 21.8%), in rural areas – at 34.8%. Against 2015, the at-risk-of-poverty rate in urban areas decreased by 2.5 percentage points (in five major cities – by 2.1, in other towns – by 3.3 percentage points), in rural areas – increased by 4.2 percentage points.
In 2016, the at-risk-of-poverty threshold was EUR 282 per month for a single person and EUR 593 per month for a family consisting of two adults and two children under 14. Compared to 2015, due to an increase in the disposable income of the population, the at-risk-of-poverty threshold grew by 9%.
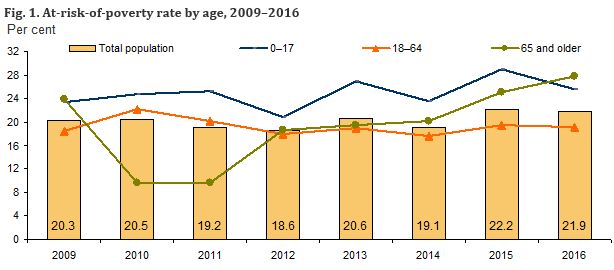
The at-risk-of-poverty rate was the highest in the age group of 65 and older: in 2016, it stood at 27.7% and, against 2015, grew by 2.7 percentage points. The growth was conditioned by an increase in the at-risk-of-poverty threshold, caused by an increase in labour income, and a relatively small increase in old-age pensions. In the income survey period (2015), the average old-age pension amounted to EUR 244.5 and stood at 86.7% of the at-risk-of-poverty threshold. It means that single old-age pensioners receiving the average or even slightly higher than the average old-age pension and having no other sources of income found themselves below the at-risk-of-poverty threshold.
In 2016, against 2015, the at-risk-of-poverty rate of the population 18–64 decreased by 0.4 percentage points and stood at 19.1%, of children under 18 – decreased by 3.3 percentage points and stood at 25.6%. The decrease was conditioned by an increase in earnings, social protection expenditure for families and children, and the minimum monthly wage, as well as by a decrease in unemployment. During the income survey period (2015), social protection expenditure for families and children grew by 5.4, average net monthly earnings – by 5.1%; moreover, the increase in the minimum monthly wage since July 1 conditioned an 8.4% increase in its average annual size. In the absence of other sources of income, the minimum wage did not protect employed persons from the risk of poverty: after the deduction of the income tax and social insurance contributions from the minimum wage, disposable income was by EUR 12 lower than the at-risk-of-poverty threshold.
In 2016, the at-risk-of-poverty rate in households with children stood at 21% and, against 2015, decreased by 2.3 percentage points. Over the year, the at-risk-of-poverty rate in households without children increased by 1.6 percentage points and stood at 22.9% in 2016. As for household composition, persons at the highest risk of poverty were those living in the households consisting of one adult with dependent children (at-risk-of-poverty rate – 41.9%) and single persons (42.7%).
Among employed persons – 8.5%, among the unemployed – 60.5%, among old-age pensioners – 30.6% were living below the at-risk-of-poverty threshold. Against 2015, the at-risk-of-poverty rate for employed persons decreased by 1.4, for the unemployed – by 1.8 percentage points, while the at-risk-of-poverty rate for old-age pensioners increased by 3 percentage points.
Table 1. At-risk-of-poverty rate before and after social transfers by household composition, %
|
|
At-risk-of-poverty rate |
At-risk-of-poverty rate
before social transfers (income including old-age and survivors' pensions
but excluding other social transfers) |
||
|
2015 |
2016 |
2015 |
2016 |
|
|
Total population |
22.2 |
21.9 |
28.6 |
27.9 |
|
single person |
39.5 |
42.7 |
42.6 |
44.5 |
|
2 adults under 65 without children |
15.4 |
15.5 |
22.7 |
21.7 |
|
2 adults, at least one aged 65 and older,
without children |
10.4 |
12.5 |
17.0 |
16.3 |
|
3 and more adults without children |
8.9 |
7.4 |
13.8 |
11.6 |
|
1 adult with at least 1 child |
47.6 |
41.9 |
50.7 |
48.4 |
|
2 adults with 1 child |
18.1 |
12.9 |
24.3 |
21.3 |
|
2 adults with at least 2 children |
24.8 |
24.4 |
33.0 |
31.7 |
|
3 and more adults with children |
15.5 |
12.4 |
25.4 |
22.2 |
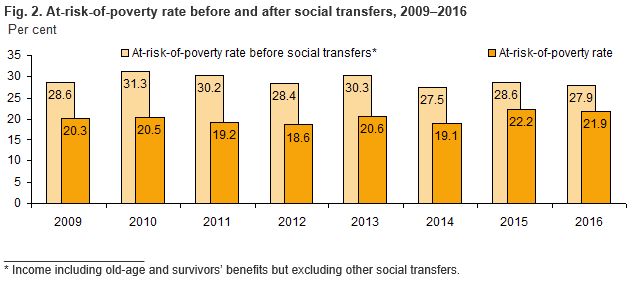
The difference between the
at-risk-of-poverty rate before and after social transfers shows the impact of
social transfers on the reduction in the risk of poverty. After the deduction
of social transfers (except for old-age and survivor's pensions) from
disposable income, the at-risk-of-poverty rate in 2016 would increase to 27.9%.
Against the previous year, the impact of social transfers on the
at-risk-of-poverty rate decreased. Social transfers had the greatest impact on
the at-risk-of-poverty rate in households with children: in 2016, after the
deduction of social transfers, the at-risk-of-poverty rate in such households
would increase from 21 to 29.1%, for children under 18 – from 25.6 to 34.2%.
In 2016, the
difference in the at-risk-of-poverty rates among the Baltic States was
marginal, while changes therein were similar to 2015. In 2016, 21.3% of
Estonian and 21.8% of Latvian population were at risk of poverty. Compared to
2015, the at-risk-of-poverty rate in Estonia decreased by 0.3, in Latvia – by
0.7 percentage points. An increase in the at-risk-of-poverty rates for people
aged 65 and older was observed in all three Baltic States.
Table 2. At-risk-of-poverty rate and threshold in Lithuania, Estonia and Latvia, %
|
At-risk-of-poverty rate, % |
|
|
|
|
|
|
|
Total population |
21.6 |
22.5 |
22.2 |
21.3 |
21.8 |
21.9 |
|
aged 0–17 |
20.0 |
23.2 |
28.9 |
18.5 |
18.6 |
25.6 |
|
aged 18–64 |
17.9 |
18.6 |
19.5 |
16.5 |
17.7 |
19.1 |
|
aged 65 and older |
35.8 |
34.6 |
25.0 |
40.2 |
38.1 |
27.7 |
|
At-risk-of-poverty threshold for a single
person, EUR per month |
394 |
291 |
259 |
429 |
318 |
282 |
Source: Database of Statistics Estonia, 26 July
2017. Database of the Central Statistical Bureau of Latvia, 26 July 2017
Data on income and living conditions were collected in February–June 2016. The 4 808 households interviewed were randomly sampled from the Population Register. In addition, income data from the State Social Insurance Fund Board (Sodra), the State Tax Inspectorate, and the Ministry of Social Security and Labour were used.
At-risk-of-poverty indicators are calculated based on the data on income for the previous year (data on income received in 2015 were used for the calculation of the at-risk-of-poverty indicators for 2016).
For more information, see the Database of Indicators and publication Income and Living Conditions, which will be published on 28 August 2017.


 «The Baltic Course» Is Sold and Stays in Business!
