
Analytics, Budget, Financial Services, Latvia, Society
International Internet Magazine. Baltic States news & analytics
Friday, 19.04.2024, 10:55
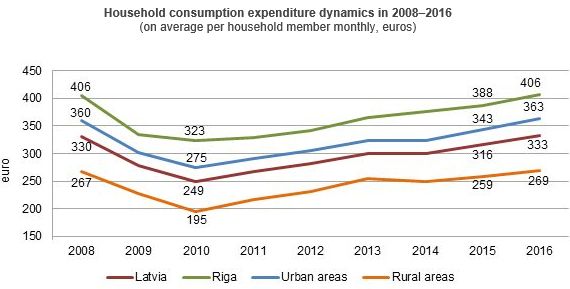
In 2016, household consumption expenditure exceeded pre-crisis level in Latvia
 Print version
Out of all households, the highest consumption expenditure was recorded in
those located in Riga – 406 euros on average per household member monthly,
which is 4.7% or 18 euros more than in 2015. Household expenditure in
urban areas grew by 5.9% or 20 euros and reached on average 363 euros per
household member monthly. In rural areas, in turn, household consumption
expenditure went up by 4.0% or 10 euros and reached on average 269 euros
per household member monthly.
The increase in the consumption expenditure was encouraged by the rise in
wages and salaries as well as employment. Compared to 2015, in 2016 net wages
and salaries grew by 4.7%, and employment rate rose by 0.8 percentage
points. However, the expenditure increase is comparatively slow, showing
that households are spending their resources with caution and making some
savings for future challenges. Data of the Financial and Capital Market
Commission1 show that, compared to the year before, at the end
of 2016 resident household investments in Latvian banks went up by 9.8% or
481 million euros.
The largest share in the total consumption expenditure is still held by the
costs on daily needs, i.e., expenditure on food, housing, transport, clothing
and footwear, as well as health. The share thereof accounted for more than two
thirds (68%) of the total consumption expenditure. Households spent the
greatest proportion (26%) of the consumption expenditure on food. Expenditure
on food on average per household member monthly grew from 84 euros in 2015
to 87 euros in 2016.
Compared to 2015, in 2016 the sharpest consumption expenditure rise was
registered in transport costs – of 11.4%. The increase was mainly affected by
the growth in expenditure on operation of and purchase of passenger cars. The second
highest growth (of 10.3%) was observed in expenditure on miscellaneous goods
and services, especially on goods and services for personal care. The third
steepest increase (9.1%) was registered in costs on health, mainly
pharmaceutical products and outpatient services.
Rise was observed also in expenditure on furnishings and household
equipment (of 8.3%), clothing and footwear (4.8%), food and non-alcoholic
beverages, communication (4.1% each), costs in restaurants and hotels (3.3%),
expenditure on alcoholic beverages and tobacco (3.1%), housing and dwelling
maintenance (2.8%), and recreation and culture (1.5%).
Composition and structure of consumption expenditure, consumer price
changes in 2016
|
All households |
Consumption
expenditure* in 2016, euros |
Expenditure
structure in 2016, % |
Changes in 2016, compared
to 2015 % |
CPI changes in 2016, compared to 2015, % |
|
Consumption
expenditure, total |
332.93 |
100 |
5.4 |
0.1 |
|
Food and non-alcoholic beverages |
87.28 |
26.2 |
4.1 |
1.1 |
|
Housing, water, electricity, gas and other fuels |
50.79 |
15.3 |
2.8 |
-2.9 |
|
Transport |
46.21 |
13.9 |
11.4 |
-2.8 |
|
Recreation
and culture |
25.26 |
7.6 |
1.5 |
1.2 |
|
Health |
21.99 |
6.6 |
9.1 |
2.6 |
|
Clothing
and footwear |
20.10 |
6.0 |
4.8 |
0.0 |
|
Miscellaneous
goods and services |
19.83 |
6.0 |
10.3 |
0.8 |
|
Restaurants,
cafés and hotels |
16.04 |
4.8 |
3.3 |
1.9 |
|
Furnishings, household equipment and routine maintenance of the house |
16.14 |
4.8 |
8.3 |
-0.2 |
|
Communication |
14.44 |
4.3 |
4.1 |
2.2 |
|
Alcoholic
beverages, tobacco |
10.79 |
3.2 |
3.1 |
3.3 |
|
Education |
4.04 |
1.2 |
-1.8 |
1.7 |
* On average per household member monthly
Last year, household consumption expenditure at current prices exceeded
that of 2008 (of pre-crisis period) by almost three euros per household
member monthly. Household expenditure (at current prices) on housing and
dwelling maintenance exceeded that of 2008 by 12 euros, expenditure on
health – by six euros, and expenditure on food and non-alcoholic beverages
– by three euros. The rise was influenced by the increase in the consumer
prices of dwelling maintenance services (of 23%), health (23%), food and
non-alcoholic beverages (11%), compared to 2008.
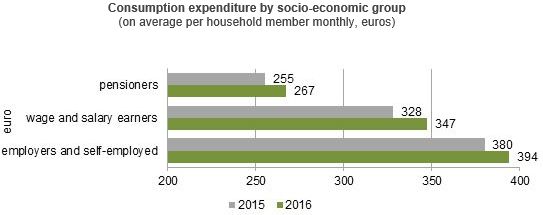
The highest consumption expenditure was still recorded in households of
employers and self-employed (394 euros) and those of wage and salary
earners (347 euros), whereas consumption expenditure in pensioner
households was notably lower – 267 euros per household member monthly. However, compared to 2015, in 2016 the sharpest consumption expenditure
rise was recorded in households of wage and salary earners – of 5.8%. In its
turn, the smallest consumption expenditure growth was observed in households of
employers and self-employed – only of 3.6%.
Data of the Household Budget Survey show – the more children in household,
the less it can afford to spend per single person. Consumption expenditure in
households with three and more children on average comprised 213 euros per
household member monthly, constituting only 64% of the average national level of
consumption expenditure (72% in 2015). Households with one child spent on
average 300 euros per household member monthly, while households with two
children – 277 euros. The highest consumption expenditure was
recorded in households with no dependent children. In 2016, the consumption
expenditure thereof on average accounted for 377 euros per household
member monthly.
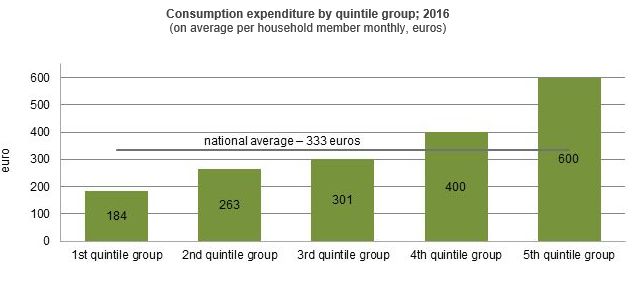
Richest households (belonging to the 5th quintile group2)
on food, housing, transport, clothing and footwear, as well as health generally
were able to spend 379 euros per household member monthly, while poorest
households (of the 1st quintile group) – 133 euros. Compared to
the poorest households, richest households spent 6 times more resources on
recreation and culture.
In 2016, Household Budget Survey engaged 3 263 households all over
Latvia.
More information on the results of the Household Budget Survey 2016 will be
available in the CSB database section Household Budget starting
from 28 August.
1Household sustainability strengthens – savings grow by 1 billion euro.
FCMC. Available at: http://www.fktk.lv/en/media-room/press-releases/6410-household-sustainability-strengthens-savings-grow-by-1-billion-euro.html
2Quintile groups are formed by arranging all households in ascending
sequence by disposable income per one household member and dividing them
afterwards in five equal groups.


 «The Baltic Course» Is Sold and Stays in Business!
