
Analytics, Baltic Export, Baltic States – CIS, EU – Baltic States, Foreign trade , Latvia
International Internet Magazine. Baltic States news & analytics
Friday, 19.04.2024, 19:33
In April, Latvian foreign trade turnover fell by 1.5%
 Print version
In April, Latvia exported goods in the amount of 834.2 million euros, while imported – in the amount of 998.2 million euros. As exports in the total foreign trade value increased up to 45.5% (in March 2016 – 44.8%), foreign trade balance improved.
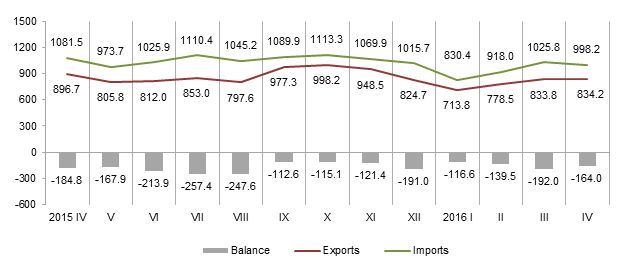 |
| Latvian foreign trade, million euros |
Notes: data on April, May, and June 2015 and January 2016 have been revised
Main exports changes in April, compared to March:
- exports of machinery and mechanical appliances; electrical equipment grew by 13.6 million euros or 10.7%,
- exports of mineral products increased by 6.3 million euros or 14.2%,
- exports of vehicles and associated transport equipment increased by 6.2 million euros or 17.3%,
- exports of products of the chemical and allied industries reduced by 13.5 million euros or 16.8%,
- exports of basic metals and articles of basic metals dropped by 6.8 million euros or 9.1%.
Main imports changes in April, compared to March:
- imports of mineral products fell by 12.7 million euros or 14.3%,
- imports of vehicles and associated transport equipment decreased by 11.9 million euros or 14.5%,
- imports of products of the chemical and allied industries reduced by 8.7 million euros or 6.3%,
- imports of wood and articles of wood dropped by 5.5 million euros or 13.4%,
- imports of machinery and mechanical appliances; electrical equipment grew by 25.3 million euros or 12.7%.
In April, Lithuania (17.8% of total exports), Estonia (12.6%), Germany (6.7%) and Poland (6.3%) were the main export partners in trade with the EU countries, whereas Lithuania (17.6% of total imports), Poland (11.7%), Germany (10.4%) and Estonia (8.5%) were the main import partners of Latvia.
Foreign trade of Latvia in April 2016 by country group, at current prices
|
|
Exports |
Imports |
||||
|
|
million euros |
% of total |
Changes as% over March 2016 |
million euros |
% of total |
Changes as% over March 2016 |
|
Total |
834.2 |
100 |
0.04 |
998.2 |
100 |
-2.7 |
|
European Union countries |
621.4 |
74.5 |
1.7 |
813.3 |
81.5 |
0.9 |
|
Euro area countries |
414.1 |
49.6 |
3.4 |
587.3 |
58.8 |
3.1 |
|
CIS countries |
97.6 |
11.7 |
11.8 |
94.9 |
9.5 |
-15.6 |
|
Other countries |
115.2 |
13.8 |
-14.8 |
90.0 |
9.0 |
-16.0 |
Russia was the main partner in the trade with third countries. In April, the share thereof in total Latvian exports accounted for 8.2%, and for 6.8% in Latvian imports.
Changes of main commodities in Latvian exports in April 2016, at current prices
|
|
thousand euros |
% of total |
Changes as% over |
||
|
April 2015 |
March 2016 |
average of the previous 12 months |
|||
|
Total |
834 186 |
100 |
-7.0 |
0.04 |
-2.2 |
|
wood and wood products; wood charcoal |
160 488 |
19.2 |
-0.5 |
-2.1 |
8.9 |
|
electrical machinery and equipment |
83 450 |
10.0 |
-26.0 |
15.6 |
-16.4 |
|
machinery and mechanical appliances |
56 410 |
6.8 |
13.0 |
4.2 |
8.3 |
|
mineral fuels, mineral oils and products of their distillation |
46 179 |
5.5 |
-15.3 |
13.8 |
-7.9 |
|
vehicles other than railway or tramway rolling stock, and parts and accessories thereof |
35 445 |
4.2 |
-18.2 |
6.1 |
-10.6 |
|
pharmaceutical products |
34 107 |
4.1 |
32.5 |
-13.6 |
19.9 |
|
articles of iron or steel |
32 695 |
3.9 |
13.6 |
16.2 |
19.2 |
|
beverages, spirits and vinegar |
28 589 |
3.4 |
13.6 |
11.2 |
-12.5 |
|
cereals |
25 399 |
3.0 |
37.1 |
-17.5 |
-30.6 |
|
furniture, other furnishing articles; prefabricated buildings |
25 237 |
3.0 |
13.2 |
1.8 |
15.3 |
As compared to April 2015, the rise in exports of cereals had an upward impact on the exports of wheat in April 2016 – of 7.4 million euros or 14.4 times. Whereas the drop of 34.3 million euros or 74.8% in exports of mobile telephones had downward effect on the imports of electrical machinery and equipment.
Changes of main commodities in Latvian imports in April 2016, at current prices
|
|
thousand euros |
% of total |
Changes as% over |
||
|
April 2015 |
March 2016 |
average of the previous 12 months |
|||
|
Total |
998 157 |
100 |
-7.7 |
-2.7 |
-2.6 |
|
electrical machinery and equipment |
117 964 |
11.8 |
-8.3 |
22.7 |
-0.7 |
|
machinery and mechanical appliances |
107 121 |
10.7 |
7.7 |
3.3 |
5.4 |
|
mineral fuels, mineral oils and products of their distillation |
73 008 |
7.3 |
-36.8 |
-14.9 |
-35.2 |
|
vehicles other than railway or tramway rolling stock, and parts and accessories thereof |
66 822 |
6.7 |
-14.2 |
-12.2 |
-15.9 |
|
pharmaceutical products |
51 544 |
5.2 |
26.1 |
0.3 |
16.1 |
|
plastics and articles thereof |
42 723 |
4.3 |
-5.5 |
4.7 |
4.1 |
|
wood and wood products; wood charcoal |
35 095 |
3.5 |
11.4 |
-13.3 |
13.8 |
|
iron and steel |
31 820 |
3.2 |
-23.3 |
14.3 |
-4.2 |
|
miscellaneous chemical products |
30 188 |
3.0 |
32.4 |
-6.1 |
2.1 times |
|
beverages, spirits and vinegar |
28 290 |
2.8 |
28.3 |
7.4 |
-0.3 |
As compared to April 2015, the growth in imports of chemical products recorded in April 2016 was mainly caused by the increase of 4.0 million euros or 23.9% in imports of insecticides, fungicides, herbicides, disinfectants and similar products. While the drop in imports of mineral fuels, mineral oils and products of their distillation was mostly influenced by the decrease of 26.9 million euros or 42.5% in imports of diesel oil.
More information on Latvian foreign trade in breakdown by month and quarter, country group, and commodity group is available in the CSB database section Foreign Trade.


 «The Baltic Course» Is Sold and Stays in Business!
