
Analytics, Baltic States – CIS, Demography, Latvia, Society
International Internet Magazine. Baltic States news & analytics
Thursday, 25.04.2024, 01:33
At the begging of 2016, Latvia’s population decreased to 1 mln 969 thousand
 Print version
In regional breakdown, increase in population number was recorded only in Pierīga region – of 0.5 thousand or 0.14%. Whereas the moist notable drop in population number still was observed in Latgale region – of 5.6 thousand or 2%. Population number in Kurzeme reduced by 3.8 thousand, in Vidzeme – by 3.2 thousand, and in Zemgale – by 2.8 thousand. Population diminish was recorded also in all cities; the greatest decline was observed in Riga (of 2 258 persons), Daugavpils (of 1 149), Liepāja (of 631), and Rēzekne (of 572), while the smallest – in Jelgava (of 135).
Last year, out of 110 counties population number increased in 17, 14 of those counties were located in Pierīga region. The highest rise in population number was observed in Mārupe (of 1 093 persons), Ķekava (of 306), Garkalne (of 244), Ādažu (of 204), Salaspils (of 176), Canrikava (of 169), and Babīte (of 154) counties. Out of the 17 counties, in 16 more persons immigrated than emigrated, while in 11 counties birth rates exceeded death rates.
In 2015, 22.0 thousand persons were born and 28.5 thousand persons died in the country. Already for four years in a row, birth rates in Latvia are growing – number of births per 1 000 population rose from 9.1 in 2011 to 11.1 in 2015.
As compared to 2014, number of immigrants dropped slightly, while number of emigrants indicates a small increase. 9.5 thousand persons arrived to Latvia (0.9 thousand less than in 2014), 59% of them were Latvia residents returning to the country. As compared to 2014, the number of emigrants grew by 1.1 thousand and reached 20.1 thousand. International long-term migration led to the fall in population number of 10.6 thousand in 2015 (in 2014 – of 8.7 thousand), and natural movement resulted in the drop of 6.5 thousand (in 2014 – of 6.7 thousand).
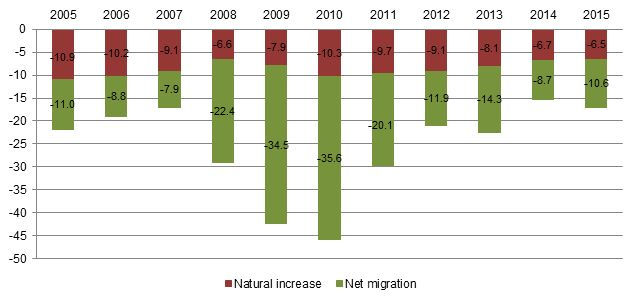 |
| Changes in Latvia population in 2005–2015 (thousand persons) |
Note: Natural increase – the difference between the number of births and the number of deaths in a given period of time. Net migration – difference between the total number of persons arriving in the country for permanent residence for at least one year and total number of persons departing from it for permanent residence or for at least one year.
Along with the increase in birth number, since 2012 number of children and young people (aged up to 14) has gone up by more than 8 thousand (in 2015 – by 2.5 thousand), amounting to 15.3% of the total population at the beginning of 2016 (14.3% at the beginning of 2012).
Number of population over working age (aged over 62) keeps increasing – in 2015 the indicator grew by 0.6 thousand. The share of elderly population in the total population increased from 23.0% in 2015 to 23.2% at the beginning of 2016. In 2015, mainly due to emigration, number of working-age population diminished by 20.3 thousand or 1.7%.
In 2015, population decline was observed among all largest Latvia ethnicities: number of Poles and Lithuanians fell by 2.2%, of Belarussians – by 2.0%, of Russians – by 1.6%, and of Latvians – by 0.6%. Nevertheless number of Latvians has dropped, the share thereof in the total population has risen slightly – from 61.6% at the beginning of 2015 to 61.8% at the beginning of 2016.
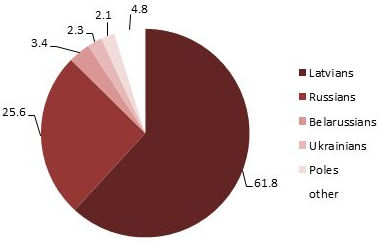 |
| Ethnic composition of Latvia population at the beginning of 2016 (%) |
Since 2011, the number of marriages has been increasing – from 5.2 marriages in 2011 to 6.9 marriages per 1 000 population in 2015. In 2011, 4.0 marriages were divorced per 1 000 population, while in 2015 the indicator has dropped by 2.6 divorces.
Death rates have not changed – 14.4 deaths per 1 000 population were recorded. It should be noted that, infant mortality has increased slightly last year – 90 children died during their first year of life, i.e., 4.1 infant deaths per 1 000 live births (in 2014 – 3.8).
Demography trends in Latvia in 2012–2015
|
|
2012 |
2013 |
2014 |
2015 |
2015 as per cent over 2014 |
2015 per 1 000 population |
|
Population number, at the end of the year |
2 023 825 |
2 001 468 |
1 986 096 |
1 968 957 |
-0.9 |
x |
|
Number of marriages |
11 244 |
11 436 |
12 515 |
13 617 |
8.8 |
6.9 |
|
Number of divorces |
7 311 |
7 031 |
6 271 |
5 151 |
-17.9 |
2.6 |
|
Number of births |
19 897 |
20 596 |
21 746 |
21 979 |
1.1 |
11.1 |
|
Number of deaths |
29 025 |
28 691 |
28 466 |
28 478 |
0.04 |
14.4 |
Key demography statistics, including population number in administrative territories at the beginning of 2016, is available in CSB database section Population and Social Processes.
Methodology used for population number estimates is available in the CSB website.


 «The Baltic Course» Is Sold and Stays in Business!
