
Analytics, Industry, Lithuania, Markets and Companies
International Internet Magazine. Baltic States news & analytics
Wednesday, 24.04.2024, 07:36
In April, the prices for Lithuanian industrial production sold increased by 1.5%
 Print version
The overall price change was mainly influenced by a 12.9% increase in prices for refined petroleum products, 0.6% – food products, as well as by a 2.9% decrease in prices for chemicals and chemical products, 1.3% – electricity, gas, steam and air conditioning supply (see Table 2).
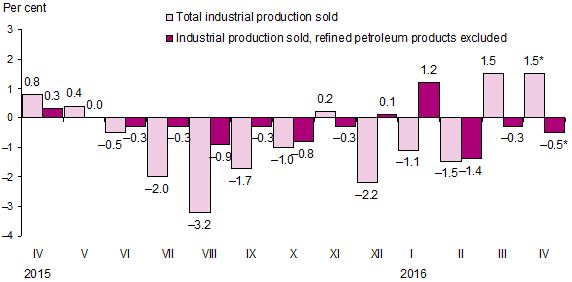 |
| Fig. 1. Changes in prices for industrial production sold over the month, compared to the previous month |
* Provisional data.
Over the month, prices for industrial production sold on the Lithuanian market decreased by 0.1%. The largest decrease in prices was observed for other non-metallic mineral products – 3%; rubber and plastic products went down in price by 2.2%. Basic metals went up in price by 2.8, other mining and quarrying – 2.6%. Food products went up in price by 1%: grain mill products – 7.1, bread and fresh pastry goods – 6.1%; yet prepared pet foods went down in price by 11.9, fruit, berry and vegetable juice – 2.8%.
Over the month, prices for products sold on the non-Lithuanian market increased by 2.8%. An increase in price was observed for refined petroleum products (16.5%) and production of extraction of crude petroleum (5.8%), while a decrease – basic metals (4%), chemicals and chemical products (3.4%).
Over the month, prices for industrial production sold on the euro area market increased by 4.3%, while on the non-euro area market – 1.7%.
Over the year (April 2016, against April 2015), prices for the total industrial production sold decreased by 9.3%, refined petroleum products excluded – 3.8%. The overall change in prices was mainly influenced by a decrease in prices for the production of manufacture of refined petroleum products (24.7%) and chemicals and chemical products (13.4%), as well as by an increase in prices for paper and paper products (2.4%).
The largest decrease in prices was observed for the production of extraction of crude petroleum (22.9%), while increase – tobacco products (17.4%).
Over the year, prices for industrial production sold on the Lithuanian market decreased by 6.6%, refined petroleum products excluded – 2.7%. The annual price change was mainly influenced by a decrease in prices for the manufacture of refined petroleum products (34.6%) and food products (2.2%), and by an increase in prices for furniture (3.5%).
Over the year, prices for industrial production sold on the non-Lithuanian market decreased by 11%, refined petroleum products excluded – 4.7%. The annual price change was mainly influenced by a decrease in prices for the manufacture of refined petroleum products (21%) and an increase in prices for the manufacture of tobacco products (17.4%).
Over the year, prices for industrial production sold on the euro area market decreased by 8.4%, while on the non-euro area market – 12.9%.

Fig. 2. Changes in prices for industrial production sold over the year, compared to the respective
month of the previous year
*
Provisional data.
** Revised data.
Table 1. Changes in prices for industrial production sold, April 2016, %
|
Economic activities |
Relative |
Price growth, drop (–) |
||
|
March 2016 |
2015 |
|||
|
December |
April |
|||
|
Total industrial production sold |
100.0 |
1.5 |
0.4 |
−9.3 |
|
Mining and quarrying |
1.0 |
1.9 |
1.2 |
−7.2 |
|
Manufacturing |
88.3 |
1.9 |
−0.2 |
−10.2 |
|
Manufacture of refined petroleum products |
15.9 |
12.9 |
8.2 |
−24.7 |
|
Electricity, gas, steam and air
conditioning |
9.8 |
−1.3 |
5.4 |
−1.4 |
|
Water supply; sewerage, waste
management and |
0.9 |
−0.2 |
0.1 |
−7.7 |
|
Total industrial production,
refined petroleum |
84.1 |
−0.5 |
−1.1 |
−3.8 |
|
Manufacturing production, refined
petroleum |
72.4 |
−0.5 |
−2.0 |
−3.9 |
|
Total industrial production sold on the Lithuanian market |
100.0 |
−0.1 |
−0.7 |
−6.6 |
|
Mining and quarrying |
1.5 |
2.4 |
2.9 |
−3.9 |
|
Manufacturing |
74.6 |
0.3 |
−2.7 |
−8.3 |
|
Manufacture of refined petroleum products |
9.6 |
1.3 |
−13.0 |
−34.6 |
|
Electricity, gas, steam and air conditioning supply |
22.7 |
−1.3 |
5.4 |
−1.4 |
|
Water supply; sewerage, waste
management and |
1.2 |
−0.1 |
0.3 |
−7.3 |
|
Total industrial production sold on the Lithuanian market, refined petroleum products excluded |
90.4 |
−0.2 |
0.6 |
−2.7 |
|
Manufacturing production, refined
petroleum |
65.0 |
0.1 |
−1.2 |
−2.9 |
|
Total industrial production sold on the non-Lithuanian market |
100.0 |
2.8 |
1.3 |
−11.0 |
|
Mining and quarrying |
0.6 |
1.0 |
−2.2 |
−13.1 |
|
Manufacturing |
98.8 |
2.8 |
1.3 |
−11.0 |
|
Manufacture of refined petroleum products |
20.7 |
16.5 |
15.8 |
−21.0 |
|
Electricity, gas, steam and air conditioning supply |
- |
- |
- |
- |
|
Water supply; sewerage, waste
management and |
0.6 |
−0.3 |
−0.1 |
−8.5 |
|
Total industrial production sold on the non-Lithuanian market, refined petroleum products excluded |
79.3 |
−0.8 |
−2.5 |
−4.7 |
|
Manufacturing production, refined
petroleum |
78.1 |
−0.8 |
−2.5 |
−4.6 |
|
Total industrial production sold on the euro area market |
100.0 |
4.3 |
2.8 |
−8.4 |
|
Total industrial production sold on the non-euro area market |
100.0 |
1.7 |
0.2 |
−12.9 |
- Such a phenomenon (indicator) was not observed during the respective
period.
Table 2. The greatest influence on the monthly (April 2016, against March) change in prices for industrial production sold by economic activity
Percentage points
|
EVRK |
Economic activities |
Influence |
EVRK |
Economic activities |
Influence |
|
Total industrial production sold |
|||||
|
19 |
Manufacture of refined petroleum |
+1.989 |
25 |
Manufacture of fabricated metal products, except machinery and equipment |
–0.050 |
|
10 |
Manufacture of food products |
+0.103 |
23 |
Manufacture of other non-metallic mineral products |
–0.052 |
|
16 |
Manufacture of wood and of products of wood, except furniture |
+0.039 |
22 |
Manufacture of rubber and plastic products |
–0.055 |
|
08 |
Other mining and quarrying |
+0.015 |
35 |
Electricity, gas, steam and air conditioning supply |
–0.136 |
|
17 |
Manufacture of paper and paper products |
+0.012 |
20 |
Manufacture of chemicals and chemical products |
–0.290 |
|
Industrial production sold on the Lithuanian market |
|||||
|
10 |
Manufacture of food products |
+0.235 |
16 |
Manufacture of wood and of products of wood, except furniture |
–0.019 |
|
19 |
Manufacture of refined petroleum |
+0.105 |
25 |
Manufacture of fabricated metal products, except machinery and equipment |
–0.030 |
|
31 |
Manufacture of furniture |
+0.095 |
22 |
Manufacture of rubber and plastic products |
–0.079 |
|
08 |
Other mining and quarrying |
+0.032 |
23 |
Manufacture of other non-metallic mineral products |
–0.132 |
|
11 |
Manufacture of beverages |
+0.021 |
35 |
Electricity, gas, steam and air conditioning supply |
–0.312 |
|
Industrial production sold on the non-Lithuanian market |
|||||
|
19 |
Manufacture of refined petroleum |
+3.443 |
22 |
Manufacture of rubber and plastic products |
–0.037 |
|
16 |
Manufacture of wood and of products of wood, except furniture |
+0.084 |
25 |
Manufacture of fabricated metal products, except machinery and equipment |
–0.065 |
|
17 |
Manufacture of paper and paper products |
+0.025 |
14 |
Manufacture of wearing apparel |
–0.065 |
|
33 |
Repair and installation of machinery and equipment |
+0.023 |
31 |
Manufacture of furniture |
–0.075 |
|
23 |
Manufacture of other non-metallic mineral products |
+0.010 |
20 |
Manufacture of chemicals and chemical products |
–0.505 |
_____________________
1 National version of NACE Rev. 2.
The overall change in prices for industrial production sold is influenced not only by the rate of change in the price of a certain product but also by the relative share (weight) of the industrial production sold within certain economic activity in the total industrial production.
For more information on the issue, please see the Database of Indicators of
Statistics Lithuania.


 «The Baltic Course» Is Sold and Stays in Business!
