
Agriculture, Analytics, Latvia, Markets and Companies
International Internet Magazine. Baltic States news & analytics
Thursday, 25.04.2024, 10:00
In 2015, price indices of agricultural output in Latvia dropped by 7.5%
 Print version
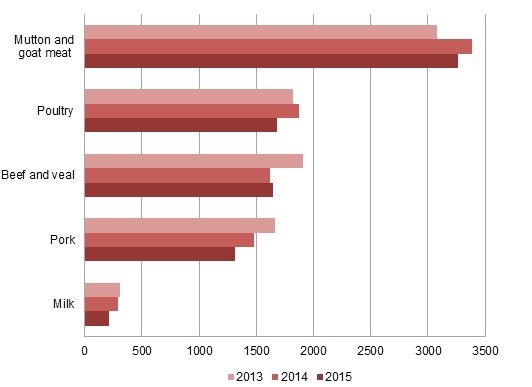
Average purchase prices of milk reduced by 25.7% – from 290.61 euros per ton in 2014 to 216.06 euros per ton in 2015. Drop in the milk purchase prices was due to the Russian import ban on agricultural products from the European Union countries, as well as situation in the European and world milk market.
In 2015, average purchase prices of meat fell by 6.1%. Purchase prices of pork reduced by 11.6% or 172.38 euros per ton and purchase prices of poultry – by 10.2% or 190.85 euros per ton. Purchase prices of mutton and goat meat indicate smaller reduction – of 3.6% or 122.63 euros per ton. Last year increase was recorded only purchase prices of beef and veal – of 1.2%, reaching 1 642.56 euros per ton.
Average purchase prices of eggs stayed at previous year level – 6.92 euros per 100 eggs.
 |
| Prices of livestock products, euros per ton |
Increase in price indices of crop products of 2.3% was mainly caused by the rise in vegetable and rape prices of 34.0% or 134.46 euros per ton and 13.6% or 40.15 euros per ton, respectively.
Average purchase prices of grain since 2012 keep decreasing, and in 2015 they fell down to 144.34 euros per ton –– by 2.6%, as compared to 2014, and by 30.3%, as compared to 2012. Grain prices were directly affected by the price drop in the world's stock exchanges.
Last year, purchase prices of food potatoes fell from 158.46 euros per ton in 2014 to 136.17 euros per ton (reduction of 14.1%).
Prices of main agricultural products, euros per ton
|
|
2013 |
2014 |
2015 |
Changes,% (2015/2014) |
|
|
Grain, total |
177.30 |
148.13 |
144.34 |
-2.6 |
|
|
Wheat |
183.01 |
155.01 |
148.46 |
-4.2 |
|
|
Rye |
149.60 |
116.85 |
117.33 |
0.4 |
|
|
Barley |
161.20 |
129.56 |
133.03 |
2.7 |
|
|
Rape seeds |
351.36 |
295.15 |
335.30 |
13.6 |
|
|
Food potatoes |
157.04 |
158.46 |
136.17 |
-14.1 |
|
|
Vegetables |
395.44 |
395.83 |
530.29 |
34.0 |
|
|
Meat, total |
1 772.47 |
1 549.82 |
1 455.68 |
-6.1 |
|
|
|
beef and veal |
1 903.99 |
1 623.84 |
1 642.56 |
1.2 |
|
|
pork |
1 662.96 |
1 484.13 |
1 311.75 |
-11.6 |
|
|
mutton, goat meat |
3 081.95 |
3 387.96 |
3 265.33 |
-3.6 |
|
|
poultry |
1 819.82 |
1 871.93 |
1 681.08 |
-10.2 |
|
Milk |
305.30 |
290.61 |
216.06 |
-25.7 |
|
|
Eggs, euros per 100 pieces |
7.12 |
6.91 |
6.92 |
0.1 |
|
Price indices of agricultural output characterises changes in agricultural product prices taking place during a certain time period over a base period – year 2010. Total agricultural output price is estimated considering average weighted prices of separate products, using estimates of the Economic Accounts for Agriculture on the base year as the weights.
Latest statistics on agricultural output prices and indices will be available on 29 April 2016 in the CSB database section Agriculture, Forestry and Fishery.


 «The Baltic Course» Is Sold and Stays in Business!
