
Analytics, Financial Services, Latvia, Society
International Internet Magazine. Baltic States news & analytics
Friday, 19.04.2024, 16:51
3 out of 10 people in Latvia are at risk of poverty or social exclusion
 Print version
The number of persons facing severe material deprivation has decreased rapidly – from 19.2% in 2014 to 16.4% in 2015.
In 2014, as population disposable income increased, at-risk-of-poverty threshold has increased – EUR 291 (EUR 260 in 2013). In 2014, 22.5% of Latvia residents, monthly disposable income (net) of which were under EUR 291, were at risk of poverty. As compared to 2013, due to increase caused by rise in income from labour that was faster than rise in income from pensions, allowances and other payments from state budget (social transfers), the share of population at risk of poverty has grown by 1.3 percentage points. In 2014, the average monthly net wages and salaries went up by EUR 44 or 8.6%, while monthly old-age pension grew on average by only EUR 7.06 or 2.7%.
The share of people aged 65 and over subjected to risk of poverty increased significantly in 2014 (from 27.6% in 2013 to 34.6% in 2014). If a person aged 65 and over lives alone, the risk of poverty in such household grew even more – from 51.1% in 2013 to 67.4% in 2014.
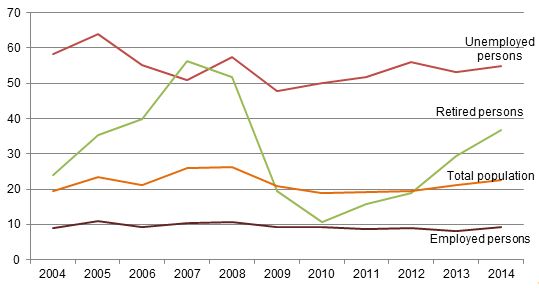 |
| At-risk-of-poverty rate by socio-economic group, 2004 – 2014 (in %) |
In single parent households with dependent children risk of poverty still is high and in 2014 it reached 37.0%. In two adult households with three or more dependent children the risk of poverty is high as well – 34.5% in 2014. Notably lower risk of poverty was observed in two adult households with one dependent child or in two adult households with two dependent children – 15.1% and 15.9%, respectively. During the last five years, share of children at risk of poverty varies between 23% and 25%, and, as compared to 2013, it has dropped by 1.1 percentage point, reaching 23.2% in 2014.
Unemployed persons are population group at very high risk of poverty (above 50%, except 47.9% in 2009) every year; in 2014 indicator reached 55.0%. At-risk-of-poverty rate among retired persons has grown rapidly – reaching 36.7% in 2014, as compared to 29.4% in 2013. In 2014, risk of poverty among employed persons has increased slightly, reaching 9.2% (in 2013 – 8.1%).
Data on relative poverty and social exclusion indicators have been obtained from "European Union Statistics on Income and Living Conditions (EU-SILC)" survey. Within the framework of EU-SILC 2014 6.1 thousand households were surveyed and 11.7 thousand respondents aged 16 years and over were interviewed. Data on household income in 2014 will be collected by the CSB in a survey of 2015.
More information on EU-SILC survey results is available in CSB database section "Monetary poverty and income inequality indicators”.
Share of population at risk of poverty by age group, 2008 – 2014 (in %)
|
|
2008 |
2009 |
2010 |
2011 |
2012 |
2013 |
2014 |
|
Total |
26.4 |
20.9 |
19.0 |
19.2 |
19.4 |
21.2 |
22.5 |
|
of which by age group (years): |
|
|
|
|
|
|
|
|
0-17 |
26.3 |
26.3 |
24.7 |
24.4 |
23.4 |
24.3 |
23.2 |
|
18-64 |
20.5 |
20.4 |
20.2 |
19.3 |
18.8 |
18.4 |
18.6 |
|
65+ |
47.6 |
17.2 |
9.1 |
13.9 |
17.6 |
27.6 |
34.6 |
Methodological explanations
Monetary poverty and social exclusion indicators on 2014 are based on population income in 2014. Unlike the CSB, Eurostat (Statistical Office of the European Communities) publishes monetary data on poverty and social exclusion with reference to the year when the survey was carried out, while population income data included in the indicator are compiled on the previous calendar year. On 16 October 2015 Eurostat published EU-SILC 2014 survey data on poverty and social exclusion, presenting income data for 2013 in Latvia.
Persons with income less than at-risk-of-poverty threshold; or explicitly materially deprived; or employed at work with low intensity are subjected to at risk of poverty or social exclusion.
At-risk-of poverty threshold is 60% of the national median equivalent disposable income.
Median is statistical indicator characterising central value (midpoint of the breakdown) of the observations grouped from the lowest value to the highest.
Severe material deprivation – it is considered that a person is subjected to severe material deprivation if he/she cannot afford at least 4 of 9 following items:
1) to pay for rent and public
utilities,
2) to keep home adequately warm,
3) to face unexpected expenses,
4) to have a meal with meat, fish or products with equivalent protein content
every second day,
5) to spend one week annual holiday away from home,
6) a personal car
7) a washing machine
8) a colour TV
9) a telephone
Work intensity is determined by the share of months in a year that all working age household members have been working during the income reference year. Individuals are classified by work intensity categories that range from WI=0 (jobless household) to WI=1 (full work intensity). It is assumed that a person lives in a household with low work intensity if WI ≤ 0.2.
Disposable (net) income is cash income from labour, employee income in kind received by using company car for private needs estimated in cash, income or losses received from self-employment, received pensions and benefits, regular material assistance from other households, profit from interests of deposits, dividends, shares, income received by children aged under 16, income from property rental, receipts from tax adjustments from the State Revenue Service (for business activities, eligible costs – education, medical treatment etc.).
At-risk-of-poverty rate – share of persons (in per cent) with an equivalised disposable income below the at-risk-of-poverty threshold.
Equivalent disposable income (net) is household disposable income calculated per equivalent consumer. It is obtained by dividing household income by equivalised household size which is made using the modified OECD equivalence scale (1.0; 0.5; 0.3). This scale gives a weight of 1.0 to the first adult, 0.5 to any other household member aged 14 and over, and 0.3 to each child aged less than 14.
Social transfers are pensions and benefits paid by the state or municipality, child maintenance payments, scholarships, social insurance benefits and compensations, including the ones paid by other countries.


 «The Baltic Course» Is Sold and Stays in Business!
