
Analytics, Baltic Export, Baltic States – CIS, EU – Baltic States, Foreign trade , Latvia
International Internet Magazine. Baltic States news & analytics
Thursday, 25.04.2024, 02:24
Foreign trade turnover reduced by 7% in August in Latvia
 Print version
In August, Latvia exported goods in amount of 784.9 mln euros, but imported – in amount of 1 032.7 mln euros. Foreign trade balance slightly worsened as exports in total foreign trade value declined to 43.2% (in July 2015 – 43.5%).
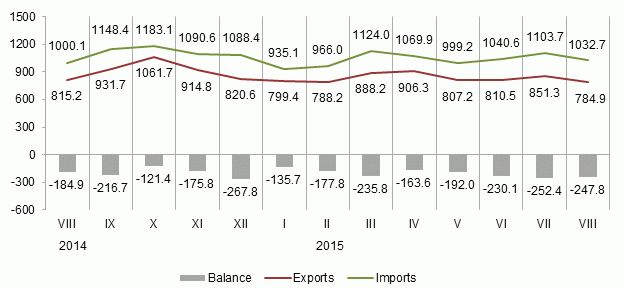 |
| Latvia’s foreign trade, mln euros (1) |
Data source: Central Statistical Bureau of Latvia
Main changes in exports in August, compared to July:
· exports of basic metals and articles of basic metals fell by 24.5 mln euros or 28.1%,
· exports of machinery and mechanical appliances; electrical equipment fell by 10.7 mln euros or 6.3%,
· exports of vehicles and associated transport equipment dropped by 8.0 mln euros or 23.6%,
· exports of live animals and animal products decreased by 7.4 mln euros or 19.3%,
· exports of pulp of wood; paper and paperboardrose by 3.3 mln euros or 17.2%.
Main changes in imports in August, compared to July:
· imports of machinery and mechanical appliances; electrical equipment fell by 44.7 mln euros or 17.3%,
· imports of products of the chemical and allied industries declined by 25.5 mln euros or 20.7%,
· imports of vehicles and associated transport equipment dropped by 24.5 mln euros or 32.0%,
· imports of mineral products rose by 17.5 mln euros or 13.3%,
· imports of vegetable products grew by 6.9 mln euros or 18.9%.
In August, main export partners in trade with the EU countries were Lithuania (21.4% of total export), Estonia (12.6%), Germany (6.8%) and the United Kingdom (6.3%); main import partners were Lithuania (20.2% of total import), Poland (10.7%), Germany (10.1%) and Estonia (7.7%).
Foreign trade of Latvia by country group in August 2015, at current prices
|
|
Exports |
Imports |
||||
|
|
mln euros |
% of total |
In % (+, –) over July 2015 |
mln euros |
% of total |
% (+, –) over July 2015 |
|
Total |
784.9 |
100 |
-7.8 |
1 032.7 |
100 |
-6.4 |
|
Member States of the European Union |
595.8 |
75.9 |
-2.0 |
819.7 |
79.4 |
-7.4 |
|
Euro area countries |
403.7 |
51.4 |
-5.2 |
607.2 |
58.8 |
-8.0 |
|
CIS countries |
95.6 |
12.2 |
-16.2 |
122.0 |
11.8 |
+5.3 |
|
Other countries |
93.5 |
11.9 |
-27.7 |
91.0 |
8.8 |
-11.4 |
Reduction in exports was mainly affected by its decrease in trade with third countries – with Algeria of 13.2 mln euros or 97.2%, with Saudi Arabia of 6.5 mln euros or 93.8%, with Turkey of 5.2 mln euros or 51.1%. Also decrease in exports to Russia, which is the largest partner in this group of countries, was significant – by 12.0 mln euros or 15.6%. Russia's share in total exports of Latvia reduced by 8.3% (in July 9.1%). At the same time its share in imports grew to 8.7% (in July 7.0%).
Changes of main commodities in Latvia’s exports in August 2015, at current prices
|
|
thsd euros |
% of total |
% (+, –) over |
||
|
August 2014 |
July 2015 |
average of previous 12 months |
|||
|
Total |
784 888 |
100 |
-3.7 |
-7.8 |
-9.4 |
|
wood and wood products; wood charcoal |
140 302 |
17.9 |
+4.9 |
-3.7 |
-2.2 |
|
electrical machinery and equipment |
99 564 |
12.7 |
-2.2 |
-11.4 |
-10.0 |
|
mineral fuels, mineral oils and products of their distillation |
60 228 |
7.7 |
-8.0 |
-2.4 |
-5.3 |
|
machinery and mechanical appliances |
59 071 |
7.5 |
+31.8 |
+3.7 |
+19.5 |
|
beverages, spirits and vinegar |
30 803 |
3.9 |
-33.8 |
-12.8 |
-23.6 |
|
articles of iron and steel |
29 050 |
3.7 |
+1.5 |
-0.9 |
+3.5 |
|
pharmaceutical products |
24 357 |
3.1 |
+4.8 |
-17.1 |
-9.4 |
|
vehicles other than railway or tramway |
22 796 |
2.9 |
-38.4 |
-23.7 |
-39.1 |
|
furniture, other furnishing articles; prefabricated buildings |
22 648 |
2.9 |
+3.9 |
+8.5 |
+1.1 |
|
plastics and articles thereof |
22 305 |
2.8 |
+8.5 |
-1.0 |
+6.1 |
|
iron and steel |
18 363 |
2.3 |
-41.2 |
-56.3 |
-41.1 |
Increase of exports of machinery and mechanical appliances; electrical equipment in August 2015, as compared to August 2014, was affected by the increase in exports of computers and units thereof by 9.5 mln euros or 2.1 time. In turn, exports of iron and steel dropped as exports of waste and scrap of cast iron decreased by 13.8 mln euros or 94.8%.
Changes of main commodities in Latvia’s imports in August 2015, at current prices
|
|
thsd euros |
% of total |
% (+, –) over |
||
|
August 2014 |
July 2015 |
average of previous 12 months |
|||
|
Total |
1 032 748 |
100 |
+3.3 |
-6.4 |
-2.8 |
|
mineral fuels, mineral oils and products of their distillation |
143 713 |
13.9 |
+3.4 |
+16.4 |
+7.9 |
|
machinery and mechanical appliances |
109 714 |
10.6 |
+24.6 |
-14.9 |
+11.9 |
|
electrical machinery and equipment |
104 794 |
10.1 |
-9.8 |
-19.5 |
-21.1 |
|
vehicles other than railway or tramway |
46 853 |
4.5 |
-12.3 |
-29.7 |
-35.2 |
|
plastics and articles thereof |
42 282 |
4.1 |
+0.9 |
-6.7 |
-4.0 |
|
iron and steel |
41 687 |
4.0 |
+5.8 |
+7.2 |
+8.7 |
|
pharmaceutical products |
36 160 |
3.5 |
+2.3 |
-31.3 |
-15.7 |
|
beverages, spirits and vinegar |
35 461 |
3.4 |
+38.8 |
+20.3 |
+22.7 |
|
wood and wood products; wood charcoal |
29 040 |
2.8 |
+19.6 |
-6.6 |
-3.7 |
Rise of imports of alcoholic and non-alcoholic beverages in August 2015, as compared to August 2014, was affected by the increase in imports of spirits by 7.3 mln euros or 72.8%. In turn, decline in imports of passenger cars by 7.9 mln euros or by 32.6% significantly influenced the total imports of vehicles other than railway or tramway rolling stock, and parts and accessories thereof.
More information on foreign trade of Latvia by month and quarter, by country group and commodity group is available in the CSB data base section Foreign Trade.
1 Data on May 2015 have been revised.


 «The Baltic Course» Is Sold and Stays in Business!
