
Analytics, Inflation, Lithuania, Markets and Companies
International Internet Magazine. Baltic States news & analytics
Tuesday, 23.04.2024, 16:27
In August, annual deflation in Lithuania stood at 1.2%
 Print version
The overall price change was mainly influenced by a decrease in prices for fuels and lubricants, vegetables, heat energy, footwear, as well as by an increase in prices for tobacco products, other financial services not elsewhere classified, housing rental services (see Table 2).
The influence of changes in prices for consumer goods on the overall monthly price change was negative and stood at minus 0.91 percentage points, while the influence of changes in prices for consumer services was positive and stood at plus 0.08 percentage points.
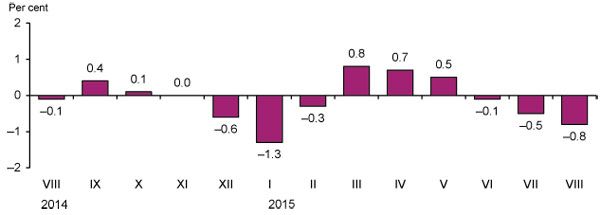 |
| Fig. 1. Monthly changes in prices for consumer goods and services, compared to the previous month |
Prices for consumer goods and services regulated by State and municipal authorities decreased by 0.9%, market prices – by 0.8%. The influence of the change in prices regulated by State and municipal authorities and market prices was negative and stood at minus 0.13 and minus 0.70 percentage points respectively.
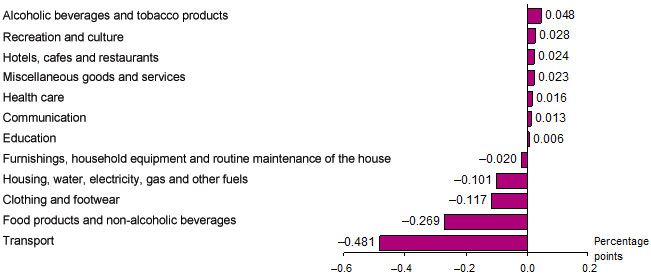 |
| Fig 2. Influence on the monthly change in prices for consumer goods and services by COICOP (1) division |
In August 2015, against July, among food products and non-alcoholic beverages, the largest decrease in prices was observed for vegetables – 11.1% (early potatoes went down in price by 35.1, cabbage – by 14.8, fruit vegetables – by 12, bulb vegetables – by 5.1, root vegetables – by 4.1, green vegetables – by 2.8%). Prices for fruit decreased by 2.2% (the largest price drop was recorded for grapes – 27.6, bananas – 10.7%, while citrus fruit went up in price by 5.2, dried fruit and nuts – by 2.4%). Groats went down in price by 2.5, edible ice – 2.4, edible offal – 2.3, pasta – 1.9, smoked meat products – 1, oil and fats – 0.6%, while prices for fruit and vegetable juices increased by 3.6%, tea and rice – by 2.3% each, chocolate – by 1.6%.
As regards energy goods, the largest price drop was observed for liquid fuel – 8.7, diesel fuel – 7, petroleum – 6.5%, liquefied gas for cars – 5.1, heat energy – 4.7%.
As for other goods, the largest price drop was observed for footwear – 3.2, tools and equipment for house and garden – 3.1, equipment for sport, camping and open-air recreation – 3, non-durable household goods – 1.6, bicycles – 1.2%, clothing and products and materials for the maintenance and repair of the dwelling – by 1.1% each, while an increase in prices was observed for articles of clothing and clothing accessories – by 2.3%, cigarettes and glassware, tableware and household utensils – by 1.7% each, flowers – by 1.4%.
As for services, the largest increase in prices was observed for housing rental – by 4.3, accommodation – by 3.1, package holidays – by 1.9, domestic services and household services – by 1.8, furniture repair – by 1.5, medical services – by 1.2%, while a decrease in prices was observed for passenger transport by air – by 8.3, sanatorium services – by 7.3%.
In August 2015, annual (August 2015, against August 2014) deflation stood at 1.2% (in August 2014, against August 2013, inflation stood at 0.2%).
Annual deflation was mainly influenced by a decrease in prices for fuels and lubricants, solid fuel, heat energy, milk and milk products, cheese, eggs, meat, as well as by an increase in prices for catering in restaurants, cafes and similar establishments, fruit, housing rental services, tobacco products, pharmaceuticals.
Over the year, prices for consumer goods decreased by 2.7%, those for services – increased by 3.2%.
In August 2015, against August 2014, prices for consumer goods and services regulated by State and municipal authorities decreased by 2.1%, market prices – by 1.1%.
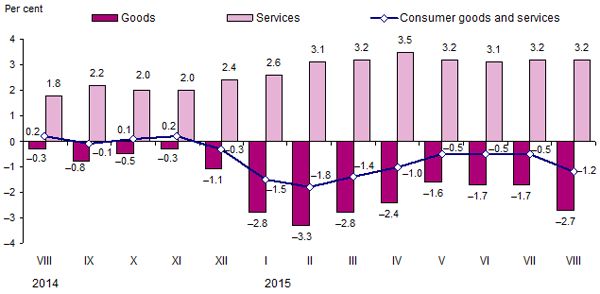 |
| Fig. 3. Annual changes in prices for consumer goods and services, compared to the respective month of the previous year |
In August 2015, average annual deflation stood at 0.7% (in August 2014, average annual inflation stood at 0.2%).
Table 1. Changes in prices for consumer goods and services, August 2015, %
|
COICOP divisions of consumer goods and services |
Relative share (weight) of consumption expenditure in total consumption expenditure |
Price growth, drop (–) |
|||
|
August 2015, against |
average annual |
||||
|
July 2015 |
2014 m. |
||||
|
December |
August |
August 2014–2015 |
|||
|
Total CPI |
100.0 |
–0.8 |
–1.1 |
–1.2 |
–0.7 |
|
Food products and non-alcoholic beverages |
24.7 |
–1.1 |
–1.2 |
–1.3 |
–0.5 |
|
Alcoholic beverages and tobacco products |
7.8 |
0.6 |
1.5 |
1.3 |
3.0 |
|
Clothing and footwear |
7.8 |
–1.6 |
–9.8 |
–1.4 |
–0.7 |
|
Housing, water, electricity, gas and other fuels |
13.6 |
–0.8 |
–5.8 |
–5.1 |
–3.4 |
|
Furnishings, household equipment and routine maintenance of the house |
5.1 |
–0.4 |
1.2 |
1.4 |
0.5 |
|
Health care |
6.3 |
0.3 |
3.3 |
3.2 |
2.4 |
|
Transport |
13.3 |
–3.5 |
–0.8 |
–6.8 |
–5.9 |
|
Communications |
3.3 |
0.4 |
0.7 |
0.0 |
–1.3 |
|
Recreation and culture |
6.4 |
0.4 |
3.0 |
1.8 |
1.4 |
|
Education |
1.7 |
0.3 |
0.6 |
2.1 |
1.6 |
|
Hotels, cafes and restaurants |
4.3 |
0.5 |
4.1 |
4.8 |
4.3 |
|
Miscellaneous goods and services |
5.7 |
0.4 |
1.6 |
3.3 |
2.2 |
Table 2. Largest influence on the overall change in consumer prices over the month by COICOP class of consumer goods and services
|
COICOP classes of consumer goods and services |
Relative share (weight) of consumption expenditure in total consumption expenditure, % |
Price growth, drop (–), % |
Influence, percentage points |
|
August 2015, against July |
|||
|
Tobacco products |
2.3 |
1.6 |
+0.039 |
|
Other financial services not elsewhere classified |
0.6 |
5.1 |
+0.030 |
|
Housing rental services |
0.6 |
4.3 |
+0.030 |
|
Pharmaceuticals |
3.6 |
0.6 |
+0.021 |
|
Package holidays |
0.9 |
1.9 |
+0.019 |
|
Telephone and telefax services |
3.1 |
0.4 |
+0.014 |
|
Fuels and lubricants |
6.2 |
–6.5 |
–0.417 |
|
Vegetables |
1.6 |
–11.1 |
–0.182 |
|
Heat energy |
2.8 |
–4.7 |
–0.116 |
|
Footwear |
2.5 |
–3.2 |
–0.073 |
|
Passenger transport by air services |
0.5 |
–8.3 |
–0.054 |
|
Clothing |
5.0 |
–1.1 |
–0.050 |
|
August 2015, against August 2014 |
|||
|
Catering services of restaurants, cafes and similar establishments |
2.7 |
5.5 |
+0.142 |
|
Fruit |
1.6 |
8.1 |
+0.135 |
|
Housing rental services |
0.6 |
22.7 |
+0.134 |
|
Tobacco products |
2.3 |
5.7 |
+0.131 |
|
Pharmaceuticals |
3.6 |
2.9 |
+0.106 |
|
Maintenance and repair of personal transport equipment |
1.7 |
3.8 |
+0.063 |
|
Fuels and lubricants |
6.2 |
–13.6 |
–0.966 |
|
Solid fuel |
2.0 |
–14.4 |
–0.296 |
|
Heat energy |
2.8 |
–9.7 |
–0.246 |
|
Milk and milk products, cheese, eggs |
4.0 |
–4.8 |
–0.193 |
|
Meat |
6.4 |
–2.5 |
–0.164 |
|
Electricity |
2.5 |
–6.3 |
–0.156 |
The overall change in consumer prices is influenced not only by the size of the
price change for a certain product but also by the relative share (weight) of
expenditure on that product in the total consumption expenditure.
In 2015, 907 consumer goods and services, whose retail prices are registered on a monthly basis in 3970 selected enterprises and local units of all forms of ownership (public, private), types (supermarkets, shopping and leisure centres, specialised and non-specialised stores, online shops, kiosks, markets, gas stations, enterprises providing catering and other services) and sizes (large, middle-sized, small), were selected for the compilation of the consumer price index.
Concepts
Deflation refers to a long-lasting decrease in the general price level, which results in an increase in the purchasing power of money.
Inflation is a long-lasting increase in the general price level, which results in a decrease in the purchasing power of money. Inflation is usually calculated based on the consumer price index and expressed in %.
Annual inflation shows the relative change in the average price level between the reporting month and the corresponding month of the previous year.
Average annual inflation shows the relative change in the average price level between the last twelve months and the corresponding previous twelve months.
For more information, see the Database of Indicators of Statistics Lithuania.


 «The Baltic Course» Is Sold and Stays in Business!
