
Analytics, Estonia, Industry, Markets and Companies
International Internet Magazine. Baltic States news & analytics
Saturday, 20.04.2024, 06:54
In July, the volume of industrial production in Estonia decreased by 6% y-o-y
 Print version
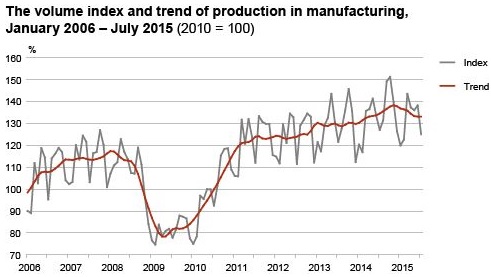
While from January until May 2015, manufacturing production grew compared to the same month of the previous year, then in May, the growth turned into decline. In May, production decreased 1%, whereas in June it rose 1% and in July it fell 2% compared to the corresponding month of the previous year. The decline in production volume in July was primarily caused by a decrease in the manufacture of electronic products, chemicals and building materials. The 12% decrease in the manufacture of electronic products was caused by the high reference base of July 2014. In July, more than a half of the branches of industry did not surpass the volume of the previous year. Although among some of the branches of industry holding larger shares (the manufacture of wood and metal products and electrical equipment), the production rose, it did not compensate for the fall in other branches.
68% of the whole production of manufacturing was sold on the external market in July. Compared to July 2014, the export sales of manufacturing production decreased 10% and that of domestic sales decreased 4% according to unadjusted data.
In July 2015 compared to June 2015, the seasonally adjusted total industrial production as well as the volume of manufacturing production fell by 1%.
Compared to July 2014, the production of electricity decreased by 37% and the production of heat by 4%. The decline in electricity generation was caused by the partial replacement of own production with cheaper imports.
Change in volume index of industrial production, July 2015 (percentages)
|
Economic activity |
Change compared to the previous month according to seasonally adjusted dataa |
Change compared to the corresponding month of the previous year |
|
|
according to unadjusted data |
according to working-day adjusted datab |
||
|
TOTAL |
-0.8 |
-6.0 |
-6.0 |
|
Energy production |
4.4 |
-31.8 |
-31.8 |
|
Mining |
-13.6 |
-18.2 |
-18.2 |
|
Manufacturing |
-0.6 |
-1.6 |
-1.6 |
|
manufacture of computer, electronic and optical products |
-1.6 |
-12.2 |
-12.2 |
|
manufacture of wood and wood products |
-1.4 |
8.5 |
8.5 |
|
manufacture of food products |
-1.8 |
-1.1 |
-1.1 |
|
manufacture of fabricated metal products |
-5.7 |
2.8 |
2.8 |
|
manufacture of electrical equipment |
6.3 |
3.8 |
3.8 |
|
manufacture of chemicals and chemical products |
-3.9 |
-5.0 |
-5.0 |
|
manufacture of furniture |
6.3 |
13.5 |
13.5 |
|
manufacture of motor vehicles |
-11.8 |
8.2 |
8.2 |
|
manufacture of building materials |
-9.7 |
-10.0 |
-10.0 |
|
manufacture of machinery and equipment |
18.8 |
22.0 |
22.0 |
a In the case of the seasonally adjusted volume index of
industrial production, the impact of the differing number of working days in a
month and seasonally recurring factors have been eliminated. It is calculated
only in comparison with the previous period.
b In the case of the working-day adjusted volume index of industrial
production, the impact of the differing number of working days in a month has
been eliminated. It is calculated only in comparison with the corresponding
period of the previous year.
The statistics are based on the questionnaires “Industry”, the submission date of which was 15.08.2015, and “Energy production, sales and fuel consumption”, the submission date of which was 10.08.2015. Statistics Estonia published the monthly overview in nine working days.


 «The Baltic Course» Is Sold and Stays in Business!
