
Analytics, Baltic, Financial Services, Lithuania, Markets and Companies, Wages
International Internet Magazine. Baltic States news & analytics
Thursday, 18.04.2024, 06:27
In 2014, 19.1% of Lithuania's population were living below the at-risk-of-poverty threshold
 Print version
In urban areas, the proportion of persons with disposable income below the at-risk-of-poverty threshold stood at 16% (in five major cities – 12.2, in other towns – 22%), in rural areas – at 25.5%. Compared to 2013, the at-risk-of-poverty rate in urban areas increased by 0.9 percentage points (in five major cities – by 0.5 percentage point, in other towns – 1.7 percentage points), while in rural areas it decreased by 6.2 percentage points.
In 2014, the at-risk-of-poverty threshold was EUR 241 per month for a single person and EUR 506 per month for a family consisting of two adults and two children under 14. Compared to 2013, due to an increase in the disposable income of the population, the at-risk-of-poverty threshold grew by 2.6%.
Those at risk of poverty were usually children under 18. In 2014, the at-risk-of-poverty rate for the children stood at 23.5% and, compared to 2013, decreased by 3.4 percentage points. Against the previous year, the at-risk-of-poverty rate for persons aged 18–64 decreased by 1.4 percentage points and stood at 17.6% in 2014. Although in the income survey period (2013) a decrease in social protection expenditure for family and children was observed, an increase in wages and salaries and a decrease in unemployment determined a decrease in the at-risk-of-poverty rate for children and persons of working age.
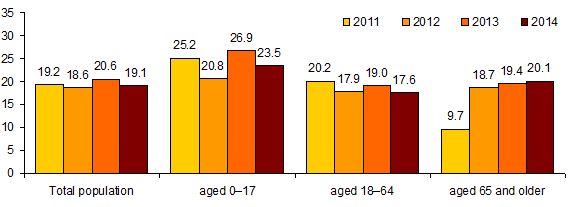 |
| Fig. 1. At-risk-of-poverty rate by age group, 2011–2014, % |
Minimum wage and salary, with no other sources of income, did not protect employed persons from risk of poverty. After the deduction of income tax and social insurance contributions from minimum wage and salary, disposable income was by EUR 0.6 lower than the at-risk-of-poverty threshold.
In 2014, the at-risk-of-poverty rate for persons aged 65 and older stood at 20.1% and, compared to 2013, grew by 0.7 percentage points. In 2013, the average old-age pension was EUR 238.1. It means that retired persons receiving the average or lower than the average old-age pension and having no other sources of income found themselves below the at-risk-of-poverty threshold.
In 2014, the at-risk-of-poverty rate in households with children stood at 20% and, against 2013, decreased by 1.8 percentage points. Over a year, the at-risk-of-poverty rate in households without children decreased by 0.8 percentage points and stood at 18.2% in 2014. As regards household composition, persons at risk of poverty were usually those living in the households consisting of one adult with dependent children (at-risk-of-poverty rate – 46%) and single persons (34.9%).
Among employed persons – 8.3%, among the unemployed – 62.6%, among retired persons – 22% were living below the at-risk-of-poverty threshold. Compared to 2013, the at-risk-of-poverty rate for employed persons decreased by 0.8 percentage points, that for retired persons – 0.7 percentage points, while that for the unemployed – increased by 1.6 percentage points.
Table 1. At-risk-of-poverty rate before and after social transfers by household composition, %
|
|
At-risk-of-poverty rate |
At-risk-of-poverty |
||
|
2013 |
2014 |
2013 |
2014 |
|
|
Total population |
20.6 |
19.1 |
30.3 |
27.5 |
|
single person |
33.7 |
34.9 |
37.5 |
38.6 |
|
2 adults, under 65, without children |
15.0 |
12.7 |
24.1 |
20.9 |
|
2 adults, at least one aged 65 and older, without children |
9.9 |
7.1 |
16.7 |
12.7 |
|
3 and more adults without children |
9.2 |
9.7 |
17.2 |
17.8 |
|
1 adult with at least 1 child |
42.8 |
46.0 |
54.3 |
52.8 |
|
2 adults with 1 child |
17.4 |
20.1 |
26.3 |
24.2 |
|
2 adults with at least 2 children |
24.0 |
19.1 |
40.2 |
32.1 |
|
3 and more adults with children |
11.6 |
9.0 |
22.1 |
22.5 |
The difference between the at-risk-of-poverty rate before and after social transfers shows the impact of social transfers on the reduction in the risk of poverty. After the deduction of social transfers (except for old-age and survivor's pensions) from disposable income, the at-risk-of-poverty rate would increase to 27.5% in 2014. Against the previous year, the impact of social transfers on the at-risk-of-poverty rate decreased. Social transfers had the greatest impact on the at-risk-of-poverty rate in households with children: in 2014, after the deduction of social transfers, the at-risk-of-poverty rate in such households would increase from 20 to 30.3%, for children under 18 – from 23.5 to 34.9%.
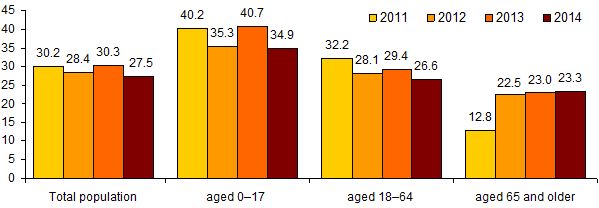 |
| Fig. 2. At-risk-of-poverty rate before social transfers, excluding pensions, by age group, 2011–2014, % |
Note. Income including old-age and survivors' benefits but excluding other social transfers.
Among the Baltic countries, in 2014, the lowest at-risk-of-poverty rate was recorded in Lithuania. In 2014, 22.1% of Estonia population and 21.2% of Latvian population were at risk of poverty. Compared to 2013, the at-risk-of-poverty rate in Estonia increased by 1.4 percentage points, that in Latvia – by 1.8 percentage points.
Table 2. At-risk-of-poverty rate and threshold in Lithuania, Estonia and Latvia
|
|
2013 |
2014 |
||||
|
Estonia |
Latvia |
Lithuania |
Estonia |
Latvia |
Lithuania |
|
|
At-risk-of-poverty rate,% |
|
|
|
|
|
|
|
Total population |
20.7 |
19.4 |
20.6 |
22.1 |
21.2 |
19.1 |
|
aged 0–17 |
18.5 |
23.4 |
26.9 |
20.2 |
24.3 |
23.5 |
|
aged 18–64 |
19.7 |
18.8 |
19.0 |
19.9 |
18.4 |
17.6 |
|
aged 65 and older |
27.0 |
17.6 |
19.4 |
31.8 |
27.6 |
20.1 |
|
At-risk-of-poverty threshold for single person, EUR per month |
333 |
233 |
235 |
358 |
260 |
241 |
Sources: Database of Statistics Estonia, 17 August 2015, Database of the Central Statistical Bureau of Latvia, 18 August 2015
Data on the income and living conditions of the population were collected in March–June 2014. The 5194 households interviewed were randomly sampled from the Residents' Register. In addition, income data from the State Social Insurance Fund Board, the State Tax Inspectorate, and the Ministry of Social Security and Labour were used.
At-risk-of-poverty indicators are calculated based on the data on income of the previous year (data on income received in 2013 were used for calculation of the at-risk-of-poverty indicators 2014).
Concepts
Household refers to a person living alone or a group of persons sharing the same living accommodation and expenditure, including collective provision of necessities of life.
Children are all persons under 18 and economically inactive (not working and not actively looking for a job) persons aged 18–24 living with at least one of the parents.
Household disposable income refers to the total income after income tax, fixed property taxes, compulsory social insurance contributions of employees, the self-employed and the unemployed and regular remittances to other households.
Equivalised disposable income is calculated by dividing the household disposable income in cash by the equivalised household size. When calculating the equivalised household size, a weight of 1 is attributed to the first member of the household, 0.5 – to each subsequent adult, and 0.3 – to each child under 14. The weights attributed to each household member are then added up to calculate the equivalised household size. E.g. the equivalised size of a single-person household equals 1, that of a 4-member household with 2 children under 14 – 2.1.
Median is the central value dividing the whole set of values in half in such a way that one half of the values is higher than the median, while the other half – lower.
Median equivalised disposable income is equal to the equivalised disposable income of a person in the middle of a series of persons arranged in ascending order of income.
At-risk-of-poverty threshold is a relative income level such that the households whose disposable income is lower than this amount are categorised as living in poverty.
The at-risk-of-poverty rate reported in this news release was calculated using the at-risk-of-poverty threshold equalling 60% of the median equivalised disposable income.
At-risk-of-poverty rate is the share of persons with equivalised disposable income below the at‑risk‑of-poverty threshold.
Social transfers refers to social benefits in cash made in the following cases: old age, sickness, for disabled persons, survivors, family and children, the unemployed, in case of social exclusion, scholarships. Housing-related allowances in kind are also included.
More information on the issue is available in the Database of
Indicators and publication Income and
Living Conditions, which will be published on 4 September 2015.


 «The Baltic Course» Is Sold and Stays in Business!
