
Analytics, Employment, EU – Baltic States, Financial Services, Latvia, Wages
International Internet Magazine. Baltic States news & analytics
Wednesday, 24.04.2024, 22:30
Employment rate in Latvia increases to 60.9% of active population
 Print version
Compared to the corresponding period of the previous year employment rate in the 2nd quarter of 2015 increased by 1.6 percentage points, and the number of employed persons – by 9.1 thsd. Employment rate for men grew by 1.9 percentage points, and for women – by 1.1 percentage point.
In the 2nd quarter of 2015 of the total number of employed persons 3.2 thsd were employed in active employment activities organised by the State Employment Agency, for example, in paid temporary public works, preserving the status of a registered unemployed person.
Since the end of 2012 employment rate in Latvia has been above the average European Union rate (in the 1st quarter of 2015 it was 57.3%), but is lower than in Estonia (63.6%).
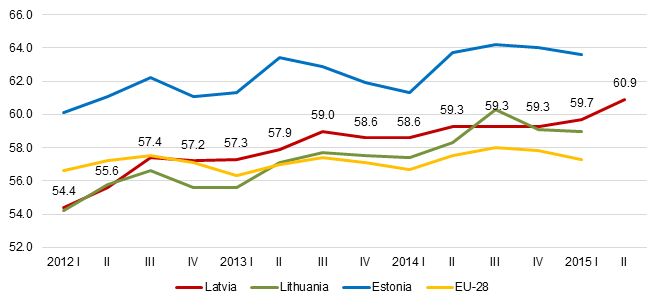 |
| Employment rate in the Baltic States and the European Union, % |
Data source: Eurostat, CSB Labour Force Survey
In the 2nd quarter of 2015, 34.6% of young people aged 15 – 24 were employed, and it is 3.7 percentage points more than in the corresponding period of the previous year. Altogether 70.3 thsd young people aged 15 – 24 were employed.
In the 2nd quarter of 2015 persons employed in the main job worked on average 38.3 hours weekly, which is 0.1 hour less than in the 2nd quarter of 2014.
Information obtained in the Labour Force Survey shows that in the 2nd quarter of 2015 as compared to the 2nd quarter of 2014, the share of employees who received net wages and salaries in the amount of up to EUR 450.00 decreased by 4.5 percentage points. At the same time, the share of employees receiving minimum wage or less grew by 4.4 percentage points. The share of employees receiving net wages and salaries in the amount of EUR 450.01 – 700.00 increased by 4 percentage points.
Employees by monthly net (after taxes) wages and salaries in the main job, %
|
|
2nd quarter of 2014 |
1st quarter of 2015 |
2nd quarter of 2015 |
|
Employees |
100.0 |
100.0 |
100.0 |
|
Up to EUR 450.00 |
53.4 |
51.2 |
48.9 |
|
of which employees receiving minimum monthly wages and salaries or less¹ |
18.5 |
20.7 |
22.9 |
|
EUR 450.01 – 700.00 |
27.3 |
30.1 |
31.3 |
|
EUR 700.01 – 1400.00 |
12.6 |
13.4 |
13.6 |
|
EUR 1400.01 and more |
2.3 |
1.9 |
1.8 |
|
Was not calculated or paid |
2.2 |
1.6 |
2.2 |
|
Not specified |
2.2 |
1.8 |
2.2 |
Data source: CSB Labour Force Survey
Within the framework of the Labour Force Survey 4.1 thsd households were surveyed in the 2nd quarter of 2015, interviewing 7.9 thsd persons aged 15 –74.
More information on the Labour Force Survey results and methodology is available in the section Employment and Unemployment.
¹ Net wages and salaries have been calculated based on the minimum gross wages and salaries. In 2014 the minimum monthly wage was EUR 320, and in 2015 it is EUR 360.


 «The Baltic Course» Is Sold and Stays in Business!
