
Analytics, Inflation, Latvia, Markets and Companies
International Internet Magazine. Baltic States news & analytics
Wednesday, 24.04.2024, 13:50
The average inflation in Latvia remained the same in July
 Print version
Prices of goods decreased by 1.0%, while prices of services rose by 2.6%. Compared to the previous 12 months, the average consumer price level over the last 12 months2, grew by 0.5%.
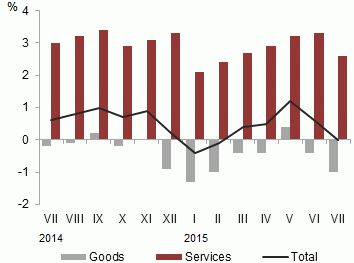 |
| Changes in consumer prices in 2014 and 2015 (% over the corresponding month of the previous year) |
Data source: Central Statistical Bureau of Latvia
The greatest pressure on the average level of consumer prices in July 2015, as compared to July 2014, was put by growth in prices of goods and services related to housing, hotel and restaurant services, individual care goods and services, as well as by drop in prices of food and non-alcoholic beverages, and transport goods and services.
Compared to the corresponding month of the previous year, the average food price level in July 2015 decreased by 2.0%. Decline of 12.1% in prices of milk and dairy products had the most significant impact. Drop was recorded in prices of meat and meat products, vegetables, sugar, oils and fats, cheese, juices and soft drinks. In turn, growth was observed in prices of fruit, tea and coffee, fish and fish products.
During the year prices of goods and services related to housing increased by 2.4%. Growth was recorded in prices of electricity, actual rentals for housing, maintenance charges in multi-occupied buildings, sewage collection; in turn, prices of heat energy and gas witnessed drop.
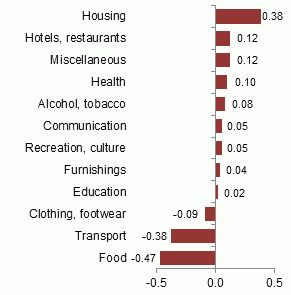 |
| Commodity group impact on Consumer Price Index during the last 12 months (percentage points) |
In transport group the average price level declined by 2.9%, which was significantly affected by drop of 11.1% in prices of fuels for transport.During the year spare parts and accessories for personal transport equipment became cheaper. Increase was observed in prices of services of passenger transport by railway and road, maintenance and repair services of personal transport equipment, parking services.
Prices of restaurant and hotel services, compared to July of the previous year, increased by 2.8%. Prices in cafés and restaurants grew by 4.2%, in canteens – by 2.6%. During the year the average price level of hotel services decreased by 13.4%.
During the year prices of individual care goods rose by 2.5%. Financial services, services of hairdressing salons and personal grooming establishments became more expensive.
Among other consumption groups, the most significant growth was recorded in prices of pharmaceutical products, telecommunication services, tobacco, beer. In turn, decline was observed in prices of footwear, clothing, wine.
Compared to the previous month, consumer prices in July 2015 decreased by 1.0%. Prices of goods declined by 1.4%, while prices of services remained the same.
The greatest pressure on the consumer price changes in July was put by drop in prices of clothing and footwear, goods and services related to housing, food and non-alcoholic beverages, recreation and culture, as well as of communication services.
Prices of food decreased by 0.9%. Affected by seasonal factors, prices of vegetables witnessed drop of 16.8%, and mainly decrease was observed in prices of tomatoes, cucumbers, cabbages and carrots. Decline was recorded in prices of sausages and smoked meat, cookies and confectionery products, tea and coffee, eggs. In turn, growth was observed in prices of fresh meat, sugar, cereal products. Potatoes also became more expensive.
Along with the continuance of the summer season sales campaigns, the prices of clothing have decreased by 7.1% and the prices of footwear – by 11.3%.
Price of natural gas for households reduced by 11.7%. Due to decrease in natural gas sale price, heat energy in July became cheaper on average by 3.6%. Prices of actual rentals for housing increased.
Cultural services became cheaper – by 4.5%, which was affected by new offers of digital and cable TV subscription. Prices of garden products and flowers, books witnessed drop.
Prices of communication services decreased by 0.5%, which was affected by reduction in prices of internet connection services.
Among other consumption groups, the most significant drop was recorded in prices of wine and fuels for transport. In turn, growth was observed in prices in cafés and restaurants, of spirits, services of passenger transport by air and sea.
Consumer price changes by commodity group, %
|
Commodity group |
Price changes in July 2015, compared to: |
||
|
July 2014 |
December 2014 |
June 2015 |
|
|
Total |
0.0 |
1.1 |
-1.0 |
|
Food |
-2.0 |
0.4 |
-0.9 |
|
Alcohol, tobacco |
0.9 |
1.1 |
0.1 |
|
Clothing, footwear |
-1.5 |
-4.3 |
-7.9 |
|
Housing |
2.4 |
2.5 |
-1.4 |
|
Furnishings |
0.9 |
0.0 |
0.2 |
|
Health |
1.8 |
1.1 |
0.3 |
|
Transport |
-2.9 |
3.3 |
0.1 |
|
Communication |
1.4 |
1.7 |
-0.5 |
|
Recreation, culture |
0.6 |
0.4 |
-1.3 |
|
Education |
1.5 |
0.0 |
0.0 |
|
Hotels, restaurants |
2.8 |
2.5 |
0.3 |
|
Miscellaneous |
2.3 |
0.7 |
-0.2 |
Sub-indices having the greatest impact, percentage points
|
During the month |
|
|
Potatoes |
+0.13 |
|
Fresh meat |
+0.03 |
|
Sausages and smoked meat |
-0.07 |
|
Gas |
-0.11 |
|
Heat energy |
-0.14 |
|
Footwear |
-0.20 |
|
Vegetables |
-0.26 |
|
Clothing |
-0.27 |
|
During 12 months |
|
|
Electricity |
+0.87 |
|
Services of passenger transport by road |
+0.18 |
|
Fruit |
+0.16 |
|
Catering services |
+0.15 |
|
Meat and meat products |
-0.16 |
|
Milk and dairy products |
-0.37 |
|
Heat energy |
-0.44 |
|
Fuels for transport |
-0.67 |
More detailed information on consumer price changes is available in the CSB database section "Consumer Prices".
1 The annual measure of inflation. The annual measure of
inflation that is used to compare the average monthly price level with the
average price level in the corresponding month of the previous year.
2 The average annual measure of inflation. The average annual
measure of inflation that is used to compare the average price level of the
last 12 months with the average price level in 12 months of the previous year.


 «The Baltic Course» Is Sold and Stays in Business!
