
Analytics, Economics, GDP, Lithuania, Markets and Companies
International Internet Magazine. Baltic States news & analytics
Thursday, 25.04.2024, 17:31
Real GDP in Lithuania grew by 1.3% in Q2
 Print version
Compared to the same period of 2014, the real GDP change, stood at 1.3%1 (seasonally and working day unadjusted – 1.3%). Compared to I quarter 2015, the real GDP change stood at 0.6%1.
In II quarter 2015, against II quarter 2014, the value added grew in most economic activities. The positive change in GDP was mainly conditioned by manufacturing, construction, wholesale and retail trade activities1.
In I half-year 2015, GDP at current prices amounted to EUR 17 511 million. Compared to I half-year 2014, real GDP change stood at 1.4%1 (seasonally and working day unadjusted – 1.2%).
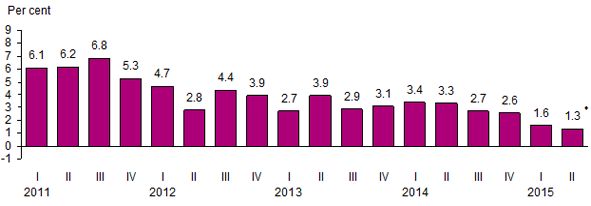 |
| Fig. 1. Changes in gross domestic product1, compared to the respective period |
-----------------------------------------------------------------
1 Seasonally and working days
adjusted.
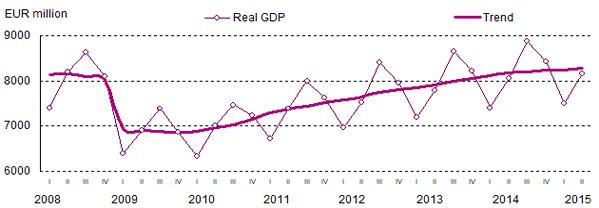 |
| Fig. 2. Changes in gross domestic product |
Statistics Lithuania, based on more detailed data and having estimated the value added by a more detailed list of economic activities, revised the GDP estimate for I quarter 2015. According to the revised data, against the same quarter of 2014, real GDP change stood at 1.6% (the previously published IV quarter real GDP change stood at 1.5%)1. In I quarter 2015, GDP at current prices amounted to EUR 8 235.9 million.
Gross domestic product and its changes
|
|
At current prices, EUR million |
GDP changes, % |
|||
|
against |
against |
seasonally and working |
|||
|
against |
against |
||||
|
2010 |
28 001.3 |
1.6 |
1.6 |
1.7 |
1.7 |
|
I |
6 281.0 |
–7.8 |
–1.0 |
0.9 |
–1.1 |
|
II |
7 155.9 |
10.5 |
1.2 |
1.6 |
1.6 |
|
III |
7 327.3 |
6.7 |
0.9 |
0.0 |
1.0 |
|
IV |
7 277.0 |
–3.2 |
5.1 |
2.5 |
5.1 |
|
2011 |
31 247.3 |
6.1 |
6.1 |
6.1 |
6.1 |
|
I |
6 905.0 |
–7.1 |
6.0 |
1.9 |
6.1 |
|
II |
7 970.4 |
10.0 |
5.5 |
1.7 |
6.2 |
|
III |
8 340.1 |
8.3 |
7.1 |
0.6 |
6.8 |
|
IV |
8 031.8 |
–4.5 |
5.7 |
1.1 |
5.3 |
|
2012 |
33 314.0 |
3.8 |
3.8 |
3.9 |
3.9 |
|
I |
7 480.5 |
–8.7 |
3.9 |
1.3 |
4.7 |
|
II |
8 316.9 |
8.0 |
2.0 |
–0.2 |
2.8 |
|
III |
8 942.2 |
11.7 |
5.1 |
2.1 |
4.4 |
|
IV |
8 574.4 |
–5.2 |
4.3 |
0.6 |
3.9 |
|
2013◘ |
34 955.6 |
3.3 |
3.3 |
3.2 |
3.2 |
|
I |
7 748.6 |
–9.8 |
3.1 |
0.2 |
2.7 |
|
II |
8 845.3 |
8.7 |
3.7 |
0.9 |
3.9 |
|
III |
9 360.5 |
10.8 |
3.0 |
1.1 |
2.9 |
|
IV |
9 001.2 |
–4.9 |
3.3 |
0.8 |
3.1 |
|
2014* |
36 308.9 |
2.9 |
2.9 |
3.0 |
3.0 |
|
I* |
8 124.2 |
–9.8 |
3.3 |
0.5 |
3.4 |
|
II* |
9 172.6 |
8.8 |
3.4 |
0.8 |
3.3 |
|
III* |
9 740.8 |
10.1 |
2.7 |
0.5 |
2.7 |
|
IV* |
9 271.4 |
–5.1 |
2.5 |
0.7 |
2.6 |
|
2015♦ |
|
|
|
|
|
|
I* |
8 235.9 |
–10.8 |
1.3 |
–0.5 |
1.6 |
|
II♦ |
9 274.9 |
8.7 |
1.3 |
0.6 |
1.3 |
♦ First estimate. * Provisional
data. ◘ Non-final data.
Real GDP changes have been estimated using a chain-linking method, which enables the elimination of the influence of price changes.
Values of and changes in GDP and its components depend on the different seasons of the year; therefore, changes used for the comparison of GDP and its components for different periods are seasonally and working day adjusted.
For more information, see the Predefined Tables and Database of Indicators.


 «The Baltic Course» Is Sold and Stays in Business!
