
Analytics, Construction, Lithuania, Real Estate
International Internet Magazine. Baltic States news & analytics
Thursday, 18.04.2024, 11:23
Construction input prices in Lithuania increased by 0.8%
 Print version
Over the month, prices for building materials and products increased by 0.2%. The largest increase in prices was observed for concrete and mortar – by 1.3, finishing materials – 0.4, wood products – 0.3%, while a decrease was observed for insulation materials – by 0.6, general building materials – 0.1%.
As for buildings and structures, the largest price growth over the month was observed for the construction of residential buildings – by 0.9%. Renovation of buildings went up in price by 1.2%.
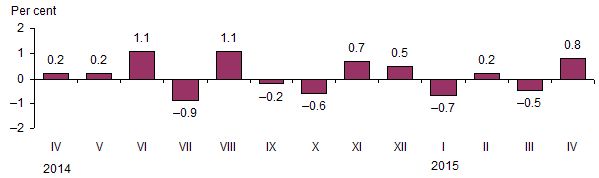 |
| Fig. 1. Changes in construction input prices over the month, compared to the previous month |
Over the year (April 2015, against April 2014), construction input prices increased by 1.6%. It was conditioned by a 6% increase in wages and salaries, 0.5% – hourly labour costs of the operation of construction machines and mechanisms, as well as by a 0.1% decrease in prices for building materials and products.
As for building materials and products, the largest price drop over the year was observed for insulation materials – by 3.2, finishing materials – 1.9, and pipes – 1.4%, while prices for general building materials increased by 1%, wood products – by 0.9%, concrete and reinforced concrete products, windows and doors – by 0.7% each.
As for buildings and structures, the largest price growth over the year was observed for the construction of residential buildings – by 2.3%. Renovation of buildings went up in price by 2.9%.
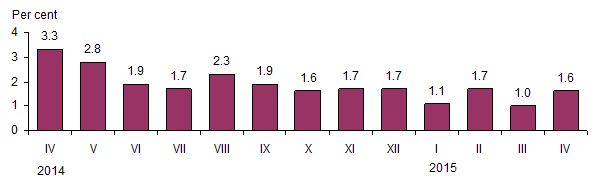 |
| Fig. 2. Changes in construction input prices over the year, compared to the same month of the previous year |
Table 1. Changes in construction input prices by type of structure, April 2015, %
|
Types of structures according to CC1 |
Relative share (weight) of the construction work carried out by type of structure in the total value of new construction |
Price
growth, drop (–), April 2015, |
||
|
March 2015 |
2014 |
|||
|
December |
April |
|||
|
All structures |
100.0 |
0.8 |
−0.2 |
1.6 |
|
Residential buildings |
9.7 |
0.9 |
−0.3 |
2.3 |
|
Non-residential buildings |
33.4 |
0.6 |
−0.2 |
1.6 |
|
Administrative |
10.9 |
0.7 |
−0.2 |
1.9 |
|
Industrial |
15.6 |
0.7 |
−0.1 |
1.7 |
|
Trade |
6.9 |
0.5 |
−0.3 |
1.2 |
|
Civil engineering units |
56.9 |
0.8 |
−0.2 |
1.5 |
|
Utility infrastructure (except for wastewater pipelines) |
29.1 |
0.9 |
−0.3 |
1.7 |
|
Wastewater pipelines |
9.9 |
0.3 |
−1.1 |
1.3 |
|
Roads and streets |
17.9 |
0.9 |
0.4 |
1.3 |
|
Renovation of buildings |
x |
1.2 |
0.0 |
2.9 |
x – the indicator is not calculated in such expression
Table 2. Changes in prices for the main construction input component groups, April 2015, %
|
Construction input component groups |
Relative
share (weight) |
Price
growth, drop (–), April 2015, |
||
|
March 2015 |
2014 |
|||
|
December |
April |
|||
|
Total construction costs |
100.0 |
0.8 |
−0.2 |
1.6 |
|
Materials and products |
62.7 |
0.2 |
−0.1 |
−0.1 |
|
Operation of machines and mechanisms |
8.1 |
0.0 |
0.3 |
0.5 |
|
Wages and salaries and overheads |
29.2 |
2.0 |
−0.5 |
5.1 |
|
Wages and salaries |
24.3 |
2.2 |
−0.5 |
6.0 |
|
Overheads |
4.9 |
0.0 |
−0.5 |
−0.7 |
Table 3. Influence on the overall monthly price change (April 2015, against March 2015) by main construction input component group, percentage points
|
Construction input component groups |
Influence |
|
Wages and salaries |
+0.635 |
|
Materials and products |
+0.131 |
The influence on the overall change in construction input prices is determined not only by the change in the construction input component price but also by the relative share (weight) of that component in the total value of construction.
A news release on changes in construction input prices in May 2015 is due on 29 June 2015.
For more information, see the Database of Indicators.
1 Classification of Types of Construction – CC


 «The Baltic Course» Is Sold and Stays in Business!
