
Analytics, Industry, Latvia, Markets and Companies
International Internet Magazine. Baltic States news & analytics
Thursday, 25.04.2024, 19:55
In March, level of producer prices in Latvian industry decreased by 0.1%
 Print version
The prices of exported products rose by 0.6%, of which in exports to euro area countries increased by 0.5%, but in exports to non-euro area countries – by 0.8%. Over the month, changes of producer prices were mostly affected by price drop in electricity, gas, steam and air conditioning supply, as well as by price rise in manufacture of wood and of products of wood, except furniture.
In March, compared to March 2014, the average level of producer prices in the Latvian industry decreased by 0.3%. Producer prices of products sold on the domestic market shrank by 0.4%, but prices of exported products – by 0.1%; of which in exports to euro area countries reduced by 0.5%, but in exports to non-euro area countries – remained at the level of the previous year. The most significant price drop was in the manufacture of food products (by 0.5 percentage points) and in electricity, gas, steam and air conditioning supply (by 0.2 percentage points).
Producer price changes in March 2015, %
|
|
Weights (%) |
Price changes (%) March 2015 compared to |
||
|
February 2015 |
March 2014 |
|||
|
Total industrial production |
100.0 |
-0.1 |
-0.3 |
|
|
|
Mining and quarrying |
2.1 |
0.5 |
1.7 |
|
|
Manufacturing |
74.3 |
0.4 |
-0.2 |
|
|
Electricity, gas, steam and air conditioning supply |
20.2 |
-1.8 |
-1.1 |
|
|
Water supply; sewerage, waste management and remediation activities |
3.4 |
-1.8 |
2.1 |
|
Products sold on the domestic market |
100.0 |
-0.8 |
-0.4 |
|
|
|
Mining and quarrying |
1.6 |
-0.1 |
-0.5 |
|
|
Manufacturing |
55.9 |
0.1 |
-0.4 |
|
|
Electricity, gas, steam and air conditioning supply |
36.9 |
-1.9 |
-0.9 |
|
|
Water supply; sewerage, waste management and remediation activities |
5.6 |
-2.1 |
3.2 |
|
Exported products |
100.0 |
0.6 |
-0.1 |
|
|
|
of which: |
|
|
|
|
|
mining and quarrying |
2.7 |
1.0 |
3.2 |
|
|
manufacturing |
94.5 |
0.6 |
-0.1 |
|
|
water supply, sewerage, waste management and remediation activities |
0.9 |
1.0 |
-5.0 |
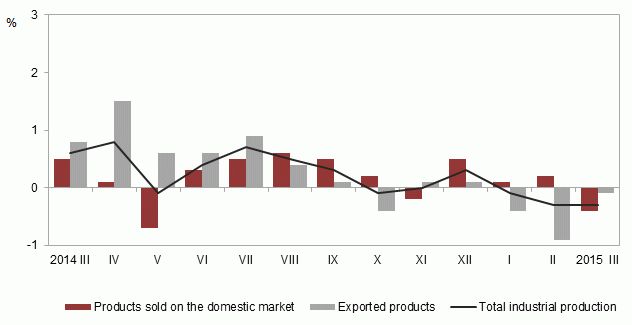 |
| Producer price changes over the corresponding month of the previous year, % |
This year data on producer prices are provided by more than 640 enterprises, which for the calculation of index each month provide the CSB with around 3 thousand prices, of which 1.6 thousand prices are for products sold on the domestic market and 1.4 thousand – for exported products and industrial services.
More detail information on producer price changes can be found in the CSB database in section Producer prices.


 «The Baltic Course» Is Sold and Stays in Business!
