
Analytics, Baltic Export, Baltic States – CIS, EU – Baltic States, Foreign trade , Latvia
International Internet Magazine. Baltic States news & analytics
Thursday, 18.04.2024, 08:14
In January, exports value of goods reduced by 3%, imports value – by 14.2% in Latvia
 Print version
Foreign trade balance improved as exports in total foreign trade value increased to 46.2% (in December 2014 – 43.2%).
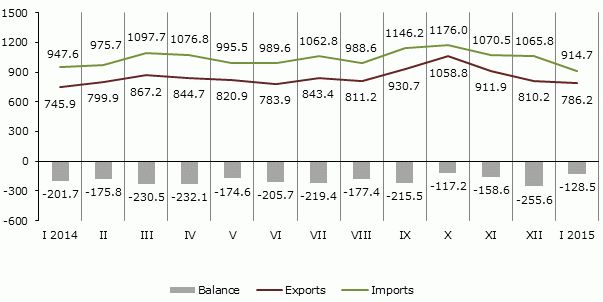 |
| Latvia’s foreign trade, mln euros (1) |
Data source: Central Statistical Bureau of Latvia
Main changes in exports in January, compared to December:
· exports of products of the chemical and allied industries fell by 14.0 mln euros or 21.9%,
· exports of optical instruments and apparatus (including medical); clocks and watches, musical instruments reduced by 6.8 mln euros or 41.0%,
· exports of basic metals and articles of basic metals grew by 29.9 mln euros or 54.2%,
· exports of wood and articles of wood increased by 3.4 mln euros or 2.6%.
Even though reduction of exports value in per cent was not very rapid, exports of prepared foodstuffs in January 2015, compared to December 2014, decreased by 44.0 mln euros or 45.7%. The largest impact had exports reduction of these goods to Russia by 26.8 mln euros or 59.1%, of which of spirits – by 20.0 mln euros or 61.8%.
Main changes in imports in January, compared to December:
· imports of vehicles and associated transport equipment dropped by 36.8 mln euros or 40.8%,
· imports of mineral products decreased by 29.7 mln euros or 18.6%,
· imports of prepared foodstuffs reduced by 27.3 mln euros or 32.9%,
· imports of products of the chemical and allied industries declined by 19.7 mln euros or 17.7%,
· imports of machinery and mechanical appliances; electrical equipment fell by 15.1 mln euros or 6.5%,
· imports of footwear and haberdashery grew by 3.2 mln euros or 69.8%.
In January main export partners were Lithuania (17.0% of total export), Estonia (11.1%), Germany (7.9%) and Poland (6.6%); main import partners were Lithuania (17.2% of total import), Poland (11.3%), Germany (9.8%) and Estonia (8.6%). The main partner in trade with third countries was Russia, share of exports reduced to 5.6% (in December 2014 – 11.3%), but share of imports was 10.1%.
Foreign trade of Latvia by country groups in January 2015, at current prices
|
|
Exports |
Imports |
||||
|
|
mln euros |
% of total |
In % (+, –) over December 2014 |
mln euros |
% of total |
In % (+, –) over December 2014 |
|
Total |
786.2 |
100 |
-3.0 |
914.7 |
100 |
-14.2 |
|
Member States of the European Union |
595.7 |
75.8 |
+3.5 |
679.2 |
74.3 |
-18.0 |
|
Euro area countries |
395.0 |
50.2 |
+2.1 |
492.2 |
53.8 |
-18.8 |
|
CIS countries |
66.8 |
8.5 |
-50.2 |
127.2 |
13.9 |
-12.4 |
|
Other countries |
123.7 |
15.7 |
+23.0 |
108.3 |
11.8 |
+16.9 |
Rise of exports of iron and steel in January 2015, as compared to January 2014, was affected by the increase in exports of waste and scrap of cast iron of 25.0 mln euros or 13 times. In turn, decline in exports of passenger cars of 2.5 mln euros or 21.5% significantly influenced the total imports of vehicles other than railway or tramway rolling stock, and parts and accessories thereof.
Changes of main commodities in Latvia’s exports in January 2015, at current prices
|
|
thsd euros |
% of total |
% (+, –) over |
||
|
January 2014 |
December 2014 |
average of previous 12 months |
|||
|
Total |
786 203 |
100 |
+5.4 |
-3.0 |
-7.8 |
|
wood and wood products; wood charcoal |
133 763 |
17.0 |
-1.5 |
+2.6 |
-6.8 |
|
electrical machinery and equipment |
113 698 |
14.5 |
+48.2 |
+7.6 |
+17.9 |
|
mineral fuels, mineral oils and products of their distillation |
61 538 |
7.8 |
+11.5 |
+13.3 |
-7.4 |
|
iron and steel |
44 796 |
5.7 |
+2.0 times |
+2.8 times |
+49.7 |
|
machinery and mechanical appliances |
37 293 |
4.7 |
+9.8 |
-22.8 |
-14.9 |
|
vehicles other than railway or tramway |
28 338 |
3.6 |
-20.7 |
-5.6 |
-22.6 |
|
cereals |
27 302 |
3.5 |
-15.8 |
+52.2 |
+5.4 |
|
articles of iron and steel |
25 592 |
3.3 |
+9.5 |
+2.1 |
-11.5 |
|
pharmaceutical products |
23 361 |
3.0 |
-2.9 |
-9.9 |
-9.6 |
|
furniture and other furnishings |
23 069 |
2.9 |
+18.0 |
+14.5 |
+9.8 |
|
beverages, spirits and vinegar |
22 250 |
2.8 |
-10.1 |
-62.5 |
-49.5 |
Rise of imports of electrical machinery and equipment in January 2015, as compared to January 2014, was mostly affected by the increase in imports of mobile phones of 18.2 mln euros or 66.1%. In turn, decline in imports of passenger cars by 7.6 mln euros or by 24.3% significantly influenced the total imports of vehicles other than railway or tramway rolling stock, and parts and accessories thereof.
Changes of main commodities in Latvia’s imports in January 2015, at current prices
|
|
thsd euros |
% of total |
% (+, –) over |
||
|
January 2014 |
December 2014 |
average of previous 12 months |
|||
|
Total |
914 654 |
100 |
-3.5 |
-14.2 |
-12.8 |
|
electrical machinery and equipment |
149 686 |
16.4 |
+50.8 |
+13.0 |
+28.9 |
|
mineral fuels, mineral oils and products of their distillation |
124 803 |
13.6 |
-20.3 |
-19.4 |
-16.5 |
|
machinery and mechanical appliances |
68 064 |
7.4 |
-10.1 |
-32.2 |
-25.3 |
|
vehicles other than railway or tramway |
48 343 |
5.3 |
-23.2 |
-43.6 |
-30.6 |
|
pharmaceutical products |
38 180 |
4.2 |
+14.5 |
-16.2 |
-7.0 |
|
plastics and articles thereof |
36 966 |
4.0 |
+4.6 |
-9.7 |
-14.0 |
|
iron and steel |
35 011 |
3.8 |
-16.4 |
+26.1 |
-8.4 |
|
wood and wood products; wood charcoal |
30 038 |
3.3 |
+25.0 |
+8.0 |
+9.1 |
More information on Latvia’s foreign trade by months and quarters by country groups and commodity groups can be obtained in the CSB data base section "Foreign trade".
1 Data on May, June and October 2014 have been revised.


 «The Baltic Course» Is Sold and Stays in Business!
