
Analytics, Baltic Export, Baltic States – CIS, Estonia, EU – Baltic States, Foreign trade
International Internet Magazine. Baltic States news & analytics
Thursday, 25.04.2024, 17:14
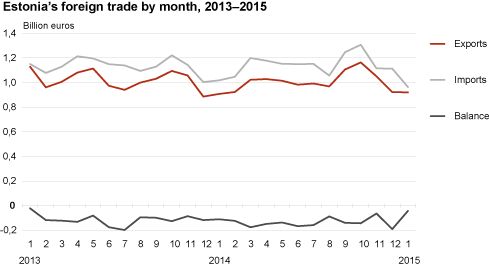
In January, imports in Estonia were at the lowest level of the recent years
 Print version
In January, exports of goods increased by 1% and imports decreased by 5% compared to January 2014. The trade deficit was 43 million euros and it decreased by 68 million euros compared to January 2014.
In January, the main commodities imported were electrical equipment (22% of Estonia’s total imports), mineral products (12%) and agricultural products and food preparations (10%). The drop in imports was influenced the most by a decrease in the imports of mineral products (down by 19 million euros), transport equipment and agricultural products and food preparations (both down by 18 million euros). At the same time, the imports of electrical equipment increased (up by 27 million euros).
The biggest share in Estonia’s exports in January was held by electrical equipment (a quarter of Estonia’s total exports), followed by mineral products (11%) and wood and products thereof (10%). The increase in exports compared to January 2014 was due to a significant increase in the exports of electrical equipment (up by 48 million euros) and mineral products (up by 7 million euros). The biggest decrease occurred in the exports of agricultural products and food preparations (down by 20 million euros) and mechanical appliances (down by 11 million euros).
The main countries of consignment in January were Finland (15% of Estonia’s total imports), Sweden (12%) and Germany (10%). The main commodities imported were mineral products and electrical equipment (from Finland), electrical and transport equipment (from Sweden) and mechanical appliances and transport equipment (from Germany).The biggest decrease occurred in imports from Finland (down by 30 million euros) and Germany (down by 29 million euros). At the same time, imports from Poland and Russia increased (both up by 12 million euros).
The top destination country of Estonia’s exports in January 2015 was Sweden (21% of Estonia’s total exports), followed by Finland (14%) and Latvia (11%). Electrical equipment and wood and products thereof were the main commodities exported to Sweden; electrical equipment and metals and products thereof were the main commodities exported to Finland; mineral products (incl. electricity) and agricultural products and food preparations were the main commodities exported to Latvia. The biggest increase occurred in exports to Sweden (up by 29 million euros) and the USA (up by 15 million euros). There was also a significant decrease in exports to Russia (down by 53 million euros) and Finland (down by 14 million euros).
In January compared to December 2014, exports stayed at the same level but imports decreased by 14%.
Estonia’s foreign trade, January, 2014–2015
|
Month |
Exports, million euros |
Imports, million euros |
Balance, million euros |
|||||
|
2014 |
2015 |
change, % |
2014 |
2015 |
change, % |
2014 |
2015 |
|
|
January |
907.4 |
920.2 |
1 |
1 018.3 |
962.8 |
-5 |
-110.9 |
-42.7 |
Main foreign trade partners of Estonia, January 2015
|
Country of destination, group of countries |
Exports, million euros |
Share, % |
Change compared to same month of previous year, % |
Country of consignment, group of countries |
Imports, million euros |
Share, % |
Change compared to same month of previous year, % |
|
TOTAL |
920.2 |
100 |
1 |
TOTAL |
962.8 |
100 |
-5 |
|
EU-28 |
701.2 |
76 |
7 |
EU-28 |
774.3 |
80 |
-8 |
|
EA19 |
419.7 |
46 |
0 |
EA19 |
513.3 |
53 |
-13 |
|
CIS |
50.5 |
5 |
-52 |
CIS |
76.9 |
8 |
13 |
|
1. Sweden |
191.6 |
21 |
18 |
1. Finland |
141.5 |
15 |
-18 |
|
2. Finland |
130.5 |
14 |
-10 |
2. Sweden |
114.3 |
12 |
0 |
|
3. Latvia |
97.7 |
11 |
-5 |
3. Germany |
96.6 |
10 |
-23 |
|
4. Germany |
48.6 |
5 |
3 |
4. Latvia |
82.7 |
9 |
-10 |
|
5. Lithuania |
47.8 |
5 |
0 |
5. Poland |
74.3 |
8 |
20 |
|
6. USA |
44.2 |
5 |
53 |
6. Lithuania |
72.0 |
7 |
1 |
|
7. Norway |
41.3 |
4 |
1 |
7. Russia |
66.3 |
7 |
22 |
|
8. Russia |
39.6 |
4 |
-57 |
8. China |
43.2 |
4 |
12 |
|
9. Denmark |
32.7 |
4 |
44 |
9. Netherlands |
37.2 |
4 |
16 |
|
10. Netherlands |
29.4 |
3 |
60 |
10. United Kingdom |
21.4 |
2 |
-30 |
Exports and imports by commodity sections, January 2015
|
Commodity section (chapter) by Combined Nomenclature (CN) |
Exports |
Imports |
Balance, million euros |
||||
|
million euros |
share, % |
change compared to same period of previous year, % |
million euros |
share, % |
change compared to same period of previous year, % |
||
|
TOTAL |
920.2 |
100 |
1 |
962.8 |
100 |
-5 |
-42.7 |
|
Agricultural products and food preparations (I–IV) |
78.5 |
9 |
-20 |
95.3 |
10 |
-16 |
-16.8 |
|
Mineral products (V) |
98.6 |
11 |
7 |
113.9 |
12 |
-14 |
-15.3 |
|
Raw materials and products of chemical industry (VI) |
38.9 |
4 |
1 |
82.6 |
9 |
9 |
-43.7 |
|
Articles of plastics and rubber (VII) |
27.1 |
3 |
-9 |
48.3 |
5 |
-10 |
-21.2 |
|
Wood and products thereof (IX) |
91.3 |
10 |
2 |
27.9 |
3 |
3 |
63.4 |
|
Paper and articles thereof (X) |
25.8 |
3 |
-3 |
20.4 |
2 |
-3 |
5.4 |
|
Textiles and products thereof (XI) |
26.2 |
3 |
-23 |
45.0 |
5 |
-18 |
-18.8 |
|
Metals and products thereof (XV) |
68.2 |
7 |
6 |
79.9 |
8 |
-4 |
-11.8 |
|
Mechanical appliances (84) |
51.1 |
6 |
-17 |
81.5 |
8 |
-8 |
-30.4 |
|
Electrical equipment (85) |
230.4 |
25 |
26 |
207.4 |
22 |
15 |
23.0 |
|
Transport equipment (XVII) |
51.7 |
6 |
8 |
74.4 |
8 |
-20 |
-22.7 |
|
Miscellaneous manufactured articles (XX) |
79.1 |
9 |
6 |
23.9 |
2 |
1 |
55.1 |
|
Other |
53.5 |
4 |
-20 |
62.2 |
6 |
-13 |
-8.7 |
The statistics are based on the reports “Intrastat” and “Exports” (sale of fish and crustaceans in foreign waters and ports)”, the due dates of which were, respectively, 14.02.2015 and 15.02.2015, and on the customs declaration data of the Estonian Tax and Customs Board, which were sent to Statistics Estonia on 20.02.2015. Statistics Estonia published the monthly summary of foreign trade in 15 working days.


 «The Baltic Course» Is Sold and Stays in Business!
