
Analytics, Inflation, Lithuania, Markets and Companies
International Internet Magazine. Baltic States news & analytics
Thursday, 25.04.2024, 17:06
In February, annual deflation in Lithuania stood at 1.8%
 Print version
The decrease was mainly influenced by a decrease in prices for footwear, solid fuel, clothing, milk and milk products, cheese and eggs, non-durable household goods and meat, as well as an increase in prices for fuels and lubricants, vegetables, fruit, magazines and periodicals (see Table 2). Monthly deflation was observed for the third month in a row.
Over the said period, prices for consumer goods decreased by 0.5%, while prices for consumer services increased by 0.1%. The influence of the change in prices of goods on the overall monthly price change was negative and stood at minus 0.35 percentage points, while the influence of the change in prices of services was positive and stood at plus 0.02 percentage points.
Prices for consumer goods and services regulated by State and municipal authorities decreased by 0.1%, market prices – 0.4%. The influence of the change in prices regulated by State and municipal authorities and market prices was negative and stood at minus 0.01 and minus 0.32 percentage points respectively.
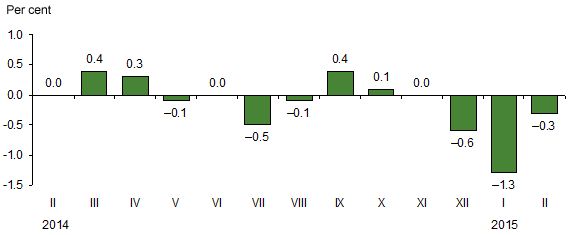 |
| Fig. 1. Monthly changes in prices for consumer goods and services, compared to the previous month |
In February 2015, against January, in the group of food products and non-alcoholic beverages, the largest decrease in prices was observed for oils and fats – 2.5%, milk and milk products, cheese – 1.7%, coffee, tea and cocoa – 1.1%, meat and bread and cereals – 0.8% each, while prices for vegetables increased by 5.1%, fruit – 1.8%, mineral water, soft drinks and juices – 1.3%.
As regards goods related to energy, the largest decrease in prices was observed for liquefied gas for cooking – 9.2, liquefied gas for cars – 6.7, solid fuel – 4.1, heat energy – 1.3%, while prices for liquid fuel increased by 6.8, diesel fuel – 4.6, petroleum – 4%.
In the group of miscellaneous services, the largest price drop was observed for footwear – 4.1%, spare parts and accessories for personal transport equipment – 2.9%, non-durable household goods and other articles of clothing and clothing accessories – 2.8% each, clothing, equipment for the reception, recording and reproduction of sound and pictures, other non-electric appliances, articles and products for personal care – 1.7% each, while prices for magazines and periodicals increased by 6.9%, plants and flowers – 1.9%, recorded media – 1.7%, tools and equipment for house and garden – 1.5%, housing maintenance and repair products and materials – 1.3%, information processing equipment – 1.1%.
As for services, the largest increase in prices was observed for actual rentals for housing – 1.2%, cleaning, repair and rental of clothing – 1%, catering in canteens – 0.8%, passenger transport by air, recreation and sport services, services of photographers – 0.7% each, package holidays – 0.6%, while prices for services of sanatoriums decreased by 3.7%, transportation services – 1.4%.
In February 2015, annual (February 2015, against February 2014) deflation
stood at 1.8% (in February 2014, against February 2013, inflation stood at
0.2%).
The annual inflation rate was mainly influenced by a decrease in prices for fuels and lubricants, heat energy, solid fuel, gas, clothing and an increase in prices for catering services in restaurants, cafes and similar establishments, tobacco products, fruit, coffee, tea and cocoa, actual rentals for housing, pharmaceuticals.
Over the year, prices for consumer goods decreased by 3.3%, those for services increased by 3.1%.
In February 2015, against February 2014, prices for consumer goods and services regulated by State and municipal authorities decreased by 2%, market prices – 1.8%.
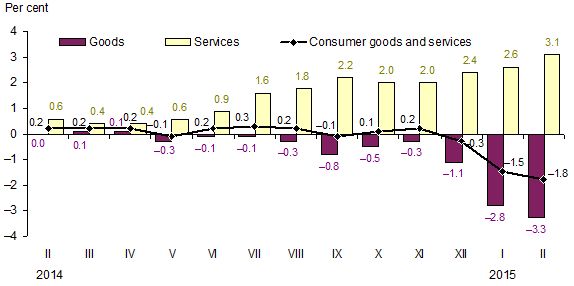 |
| Fig. 2. Annual changes in prices for consumer goods and services, compared with the corresponding month of the previous year |
In February 2015, average annual deflation stood at 0.2%. In February 2014, average annual inflation stood at 0.7%.
Table 1. Changes in prices for consumer goods and services, February 2015, %
|
COICOP divisions of consumer goods and services |
Relative share (weight) of
consumption |
Price growth, drop (–) |
|||
|
February 2015, against |
average annual |
||||
|
January 2015 |
2014 |
||||
|
December |
February |
||||
|
Total CPI |
100.0 |
–0.3 |
–1.6 |
–1.8 |
–0.2 |
|
Food products and non-alcoholic beverages |
24.7 |
–0.3 |
0.1 |
–1.1 |
0.5 |
|
Alcoholic beverages and tobacco products |
7.8 |
–0.4 |
0.0 |
2.6 |
3.8 |
|
Clothing and footwear |
7.8 |
–2.5 |
–10.7 |
–2.3 |
–0.5 |
|
Housing, water, electricity, gas and other fuels |
13.6 |
–1.0 |
–3.0 |
–4.6 |
–1.4 |
|
Furnishings, household equipment and routine maintenance of the house |
5.1 |
–1.2 |
0.2 |
0.0 |
–0.2 |
|
Health care |
6.3 |
0.1 |
0.9 |
2.6 |
1.6 |
|
Transport |
13.3 |
1.2 |
–4.8 |
–10.2 |
–3.5 |
|
Communications |
3.3 |
–0.3 |
–0.3 |
–0.5 |
–5.4 |
|
Recreation and culture |
6.4 |
0.7 |
1.3 |
1.3 |
0.4 |
|
Education |
1.7 |
0.0 |
0.1 |
1.7 |
1.2 |
|
Hotels, cafes and restaurants |
4.3 |
0.3 |
1.1 |
4.5 |
3.3 |
|
Miscellaneous goods and services |
5.7 |
–0.8 |
1.0 |
2.7 |
1.1 |
Table 2. Largest influence on the overall change in consumer prices over the month by COICOP class of consumer goods and services
|
COICOP classes of consumer goods and services |
Relative share (weight) of consumption expenditure in total consumption expenditure,% |
Price growth, drop (–),% |
Influence, percentage points |
|
February 2015, against January |
|||
|
Fuels and lubricants |
6.2 |
2.9 |
+0.163 |
|
Vegetables |
1.6 |
5.1 |
+0.085 |
|
Fruit |
1.6 |
1.8 |
+0.030 |
|
Magazines and periodicals |
0.4 |
6.9 |
+0.026 |
|
Beer |
1.5 |
1.0 |
+0.015 |
|
Housing maintenance and repair products and materials |
1.1 |
1.3 |
+0.014 |
|
|
|
|
|
|
Footwear |
2.5 |
–4.1 |
–0.096 |
|
Solid fuel |
2.0 |
–4.1 |
–0.078 |
|
Clothing |
5.0 |
–1.7 |
–0.076 |
|
Milk and milk products, cheese and eggs |
4.0 |
–1.5 |
–0.060 |
|
Non-durable household goods |
2.0 |
–2.8 |
–0.057 |
|
Meat |
6.4 |
–0.8 |
–0.054 |
|
February 2015, against February 2014 |
|||
|
Services of restaurants, cafes and similar establishments |
2.7 |
5.4 |
+0.131 |
|
Tobacco products |
2.3 |
5.2 |
+0.119 |
|
Fruit |
1.6 |
7.1 |
+0.112 |
|
Coffee, tea and cocoa |
1.1 |
10.4 |
+0.105 |
|
Actual rentals for housing |
0.6 |
14.8 |
+0.079 |
|
Pharmaceuticals |
3.6 |
2.0 |
+0.071 |
|
|
|
|
|
|
Fuels and lubricants |
6.2 |
–19.2 |
–1.372 |
|
Heat energy |
2.8 |
–9.3 |
–0.287 |
|
Solid fuel |
2.0 |
–13.2 |
–0.279 |
|
Gas |
1.2 |
–17.6 |
–0.229 |
|
Clothing |
5.0 |
–3.6 |
–0.211 |
|
Vegetables |
1.6 |
–10.1 |
–0.202 |
The overall change in consumer prices is influenced not only by the size of the price change for a certain product but also by the relative share (weight) of expenditure on that product in the total consumption expenditure.
Concepts
Deflation refers to a long-lasting decrease in the general price level, which results in an increase in the purchasing power of money.
Inflation is a long-term increase in the general price level, resulting in a decrease in the purchasing power of money. Inflation is usually calculated based on the consumer price index and expressed in per cent.
Annual inflation shows the relative change in the average price level between the reporting month and the corresponding month of the previous year.
Average annual inflation shows the relative change in the average price level between the last twelve months and the corresponding previous twelve months.
More information on the issue is available in the Database of Indicators of Statistics Lithuania.


 «The Baltic Course» Is Sold and Stays in Business!
