
Analytics, Inflation, Latvia, Markets and Companies
International Internet Magazine. Baltic States news & analytics
Thursday, 18.04.2024, 02:33
Annual deflation in Latvia constituted 0.1% in February
 Print version
Compared to the previous 12 months, the average consumer price level over the last 12 months2, increased by 0.5%.
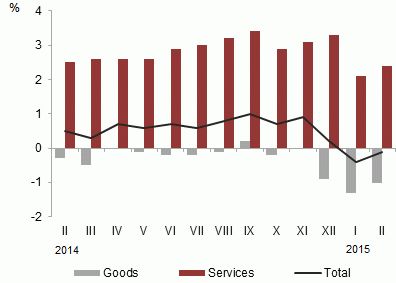 |
| Changes in consumer prices in 2014 and 2015 (% over the corresponding month of the previous year) |
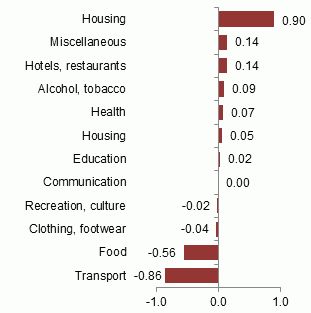 |
| Commodity group impact on Consumer Price Index over the last 12 months (percentage points) |
Data source: Central Statistical Bureau of Latvia
Compared to February 2014, the greatest pressure on the price changes in February 2015 was put by drop in prices of transport goods and services, food and non-alcoholic beverages, as well as by rise in prices of goods and services related to housing, hotel and restaurant services, individual care goods and services, alcoholic beverages and tobacco.
The average food price level in February 2015 as compared to the corresponding month of the previous year decreased by 2.3%. The drop of milk and dairy products prices (-8.4%) had the most significant lowering impact on the price level. Drop was also observed in prices of vegetables, meat and meat products, sugar, oils and fats, fruit. In turn, growth was recorded in prices of ground coffee, confectionery and honey, fish and fish products.
Prices of tobacco rose by 9.5%. The average price level of alcoholic beverages dropped by 3.1%. Prices of beer, wine and spirits reduced.
During the year prices of goods and services related to housing increased by 5.6%. Growth was recorded in prices of electricity, water supply, sewage collection, maintenance charges in multi-occupied buildings; in turn, prices of heat energy and gas witnessed a fall.
In transport group prices declined by 6.3%, which was significantly affected by price drop of fuels for transport of 17.3%. A decrease was also registered in the prices of spare parts and accessories for personal transport equipment. But price growth was observed for the services of passenger transport by railway and road.
Compared to February of previous year, prices of hotel and restaurant services increased by 3.3%. Prices in cafés and restaurants increased by 3.5%, in canteens - by 3.1%, and for accommodation services - by 1.9%.
Prices of individual care goods on average increased by 4.1%. During the year prices rose on services of hairdressing salons and personal grooming establishments, financial services. Prices of insurance services reduced.
Among other commodity groups, the most significant decrease was recorded in prices of package holidays, hospital services, footwear. In turn, the largest growth was observed in prices of cultural services, non-durable household goods.
Compared to the previous month, consumer prices in February 2015 grew by 0.3%. Prices of goods increased by 0.1%, while prices of services – by 0.7%.
The greatest pressure on the consumer prices in January was put by growth in the prices of transport goods and services, food and non-alcoholic beverages, as well as by drop in the prices of clothing and footwear, goods and services related to housing.
Prices of food grew by 0.7%. Affected by seasonal factors, significant price rise of 14.6% was observed for vegetables, mainly cucumbers and tomatoes. Bread and cereals, meat and meat products, oil and fats, fruit became more expensive.
Prices of milk and dairy products, grounded coffee, cheese, sugar reduced.
Affected by seasonal discounts and sales, prices of footwear dropped by 4.9% and prices of clothing - by 1.6%.
Due to decrease in natural gas sale prices, heat energy in February on average became cheaper by 1.6%. Decrease was recorded in prices of materials for the maintenance and repair of the dwelling.
In transport group average price level rose by 3.0%, which was affected by tariff change for the services of passenger transport by road and railway in Riga, which entered into force as of 1 February. Prices of fuel grew by 2.9%.
The most notable rise among other consumption groups was recorded in the prices of pharmaceutical products, spirits. Prices of non-durable household goods, package holidays, beer reduced.
Consumer price changes by commodity group, %
|
Commodity group |
Price changes in February 2015, compared to: |
||
|
February 2014 |
December 2014 |
January 2015 |
|
|
Total |
-0.1 |
0.3 |
0.3 |
|
Food |
-2.3 |
0.5 |
0.7 |
|
Alcohol, tobacco |
1.2 |
0.5 |
-0.1 |
|
Clothing, footwear |
-0.7 |
-9.0 |
-2.5 |
|
Housing |
5.6 |
4.9 |
-0.5 |
|
Furnishings |
1.1 |
-0.5 |
-1.3 |
|
Health |
1.3 |
-0.3 |
0.6 |
|
Transport |
-6.3 |
-0.7 |
3.0 |
|
Communication |
-0.1 |
0.0 |
0.0 |
|
Recreation, culture |
-0.2 |
-0.1 |
-0.2 |
|
Education |
1.5 |
0.0 |
0.0 |
|
Hotels, restaurants |
3.3 |
0.6 |
0.0 |
|
Miscellaneous |
2.7 |
0.7 |
-0.3 |
Sub-indices having the greatest impact, percentage points
|
During the month |
|
|
Vegetables |
+0.20 |
|
Services of passenger transport by road |
+0.17 |
|
Fuels for transport |
+0.16 |
|
Services of passenger transport by railway |
+0.06 |
|
Clothing |
-0.06 |
|
Heat energy |
-0.07 |
|
Milk and dairy products |
-0.07 |
|
Footwear |
-0.07 |
|
During 12 months |
|
|
Electricity |
+0.88 |
|
Tobacco |
+0.26 |
|
Services of passenger transport by road |
+0.17 |
|
Package holidays |
-0.11 |
|
Meat and meat products |
-0.15 |
|
Vegetables |
-0.21 |
|
Milk and dairy products |
-0.25 |
|
Fuels for transport |
-1.09 |
Information on Consumer Price Index in March 2015 will be published on April 10.
More detailed information on consumer price changes is available in the CSB database section Consumer prices.
1 The annual measure of inflation. The annual measure of
inflation that is used to compare the average monthly price level with the
average price level in the corresponding month of the previous year.
2 The average annual measure of inflation that is used to compare
the average price level of the last 12 months with the average price level in
12 months of the previous year.


 «The Baltic Course» Is Sold and Stays in Business!
