
Analytics, Baltic, Economics, GDP, Latvia, Markets and Companies
International Internet Magazine. Baltic States news & analytics
Tuesday, 23.04.2024, 20:20
In 2014, gross domestic product rose by 2.4% in Latvia
 Print version
In the 4th quarter of 2014 GDP at constant prices, according to seasonally adjusted data, rose by 2.1%, compared to the 4th quarter of 2013. But, compared to the 3rd quarter of 2014 – growth comprised 0.6%.
According to seasonally unadjusted data, compared to the corresponding period of 2013, the GDP in the 4th quarter of 2014 grew by 2.1%.
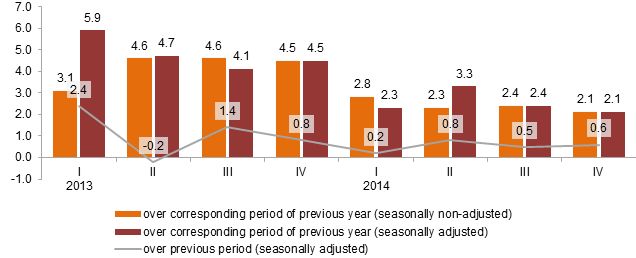 |
| Changes of GDP volume (at constant prices, as %) |
Data source: Central Statistical Bureau of Latvia
Production approach (seasonally non-adjusted data, at constant prices)
In 2014, compared to 2013, there was an increase in four main manufacturing sectors: manufacture of wood and of products of wood rose by 7%, manufacture of food products – by 2%, manufacture of fabricated metal products – by 2% and manufacture of non-metallic mineral products – by 1%. Manufacturing rate was negatively affected by production volume reduction in repair and installation of machinery and equipment by 25%, in manufacture of wearing apparel – by 17% and in manufacture of beverages – by 11%.
Construction production volume rose by 8%. Construction of highways, streets, roads and railways comprised the largest volume (21% of total), which still was 2% less than in 2013. Volumes in construction of residential buildings increased by 31%, in construction of educational buildings – by 88%, in construction of industrial buildings and warehouses – by 9%. Construction volume of main pipelines, communication and power lines decreased by 22%.
Retail trade grew by 4%, of which retail sale of automotive fuel – by 6%. There was a 3% increase both in trade of food products and in trade of non-food products.
Increase in transport sector was promoted by turnover growth of 7% in road transport and of 5% – at ports. Passenger transportation in road transport remained at the level of the previous year.
In accommodation and food service activities there was an increase of 3% and 4%. Activity of travel agencies has gone up by 3%.
Volume of entertainment and recreation services increased by 10%, but in gambling and betting sector there was a rise of 8%.
In the 4th quarter of 2014, compared to the 4th quarter of 2013, manufacturing rate has dropped by 2%. Reduction was observed in two main sectors of manufacturing: in manufacture of food products – by 4% and in manufacture of fabricated metal products – by 0.3%. Drop was also observed in the manufacture of non-metallic mineral products by 0.1%. Manufacturing was positively affected by production volume growth in wood and of products of wood sub-sector by 4%, in manufacture of furniture – by 10% and in manufacture of computer, electronic and optical products – by 58%.
Rise in construction rate was promoted by growth in construction of highways, streets and roads by 13% and of residential buildings – by 9%. Volume of construction and repair of educational buildings increased by 86%. Construction of civil engineering structures reduced by 8%, which was significantly affected by drop in production volume of construction of main pipelines, communication and power lines by 31%, as well as of construction of ports – by 57%.
Retail trade in the 4th quarter of 2014 grew by 4%, of which retail sale of automotive fuel – by 11%. Retail trade of food products rose by 1%, but of non-food products (excluding automotive fuel) – by 4%.
In accommodation and food service activities there was an increase of 1% and 4%. Volume of services of travel agencies, tour operators and booking increased by 1%.
Increase in transport sector was promoted by turnover growth in road transport activity: by 13% – in freight transport and by 3% – in passenger transport. Freight turnover at ports rose by 10%.
Rise in entertainment and recreation sector comprised 13%, but in gambling and betting sector – 11%.
Changes of GDP in 2014 by kind of economic activity
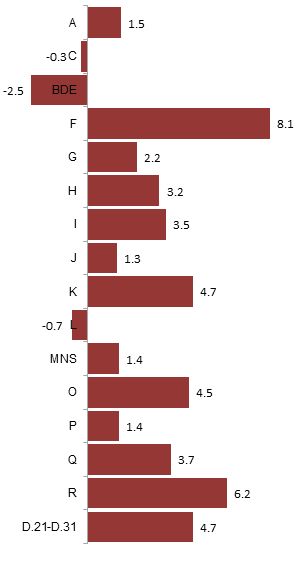 |
| at constant prices, % over 2013 |
|
NACE Rev. 2 activities |
Structure of activities at current prices, % |
|
Agriculture, forestry and fishing (A) |
3.4 |
|
Manufacturing (C) |
12.2 |
|
Other industry (BDE) |
4.2 |
|
Construction (F) |
6.7 |
|
Trade (G) |
14.0 |
|
Transportation and storage (H) |
9.6 |
|
Accommodation and food service activities (I) |
1.7 |
|
Information and communication (J) |
4.7 |
|
Financial and insurance activities (K) |
4.3 |
|
Real estate activities (L) |
12.9 |
|
Commercial services (MNS) |
9.1 |
|
Public administration and defence; compulsory social security (O) |
7.3 |
|
Education (P) |
4.7 |
|
Human health and social work activities (Q) |
3.1 |
|
Arts, entertainment and recreation (R) |
2.1 |
|
Taxes on products minus subsidies on products (D.21-D.31) |
x |
Expenditure approach (seasonally non-adjusted data)
In 2014, compared to 2013, private final consumption at current prices grew by 3%. Households' expenditure in main expenditure groups increased: on food – by 4%, expenditure on housing – by 0.2% and on transport – by 1%, as well as more by 6% for recreational and cultural goods and activities. Gross fixed capital formation increased by 4%. Export of goods increased by 3%, but export of services – reduced by 5%. Import of goods went up by 2%, while import of services – dropped by 5%.
Private final consumption at constant prices has risen by 2%, of which expenditure on food – by 4%, on transport – by 2%, on recreation and culture – by 5%. But expenditure on housing decreased by 1%.
Expenditure on gross fixed capital formation increased by 2%. It was affected by rise of investment in transportation and storage sector by 13%, in manufacturing – by 22%. Investment in public administration reduced by 4%.
Export of goods increased by 5%, but export of services – reduced by 5%. Import of goods grew by 2%, while import of services decreased by 3%.
In the 4th quarter of 2014, compared to the 4th quarter of 2013, private final consumption at current prices grew by 3%. Households' expenditure on food rose by 2%, but expenditure on housing – by 0.2%. Households' expenditure on transport reduced by 2% (expenditure on public transport, purchase and exploitation of transport vehicle). Gross fixed capital formation increased by 3%. Export of goods increased by 4%, but export of services – reduced by 8%. Import of goods went up by 3%, while import of services – dropped by 5%.
Private final consumption at constant prices has risen by 2%, of which expenditure on food – by 3%, on transport – by 2%, on recreation and culture – by 9%. But expenditure on housing decreased by 2%. Expenditure on gross fixed capital formation increased by 0.4%. Export of goods increased by 5%, but export of services – reduced by 6%. Import of goods grew by 4%, while import of services decreased by 7%.
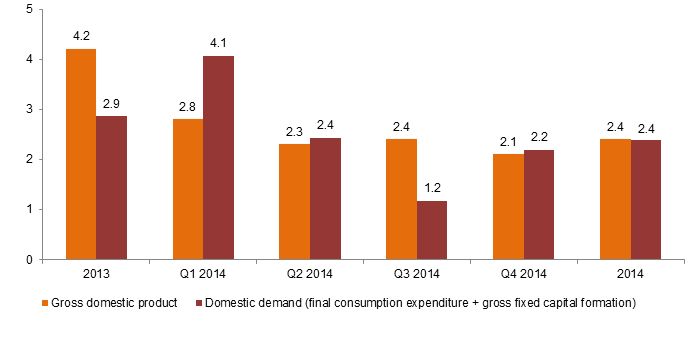 |
| Gross Domestic Product and domestic demand (at constant prices, % of the corresponding period of the previous year) |
Data source: Central Statistical Bureau of Latvia
Data
source: Central Statistical Bureau of Latvia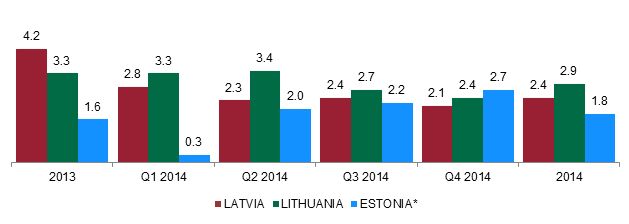
Changes of Gross Domestic Product in the Baltic Countries (at constant prices, seasonally non-adjusted,
% of the corresponding period of the previous year)
*Flash estimate data for the 4th quarter of 2014
Possible changes in calculations of government sector, payment balance and sectors of financial services, as well as services producer indices will be taken into account in GDP calculations and balancing of quarterly national accounts. More information on these indicators will be available in the CSB database on 85th day after the reference quarter – on 26 March.
More detailed information on GDP time series is available in the CSB database in section Gross Domestic Product.


 «The Baltic Course» Is Sold and Stays in Business!
