
Analytics, Inflation, Latvia, Markets and Companies
International Internet Magazine. Baltic States news & analytics
Wednesday, 24.04.2024, 17:36
In January, annual deflation 0.4% registered in Latvia
 Print version
Compared to the previous 12 months, the average consumer price level over the last 12 months2 increased by 0.6%.
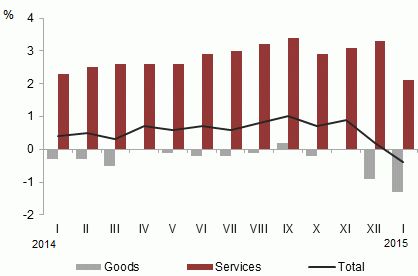 |
| Changes in consumer prices in 2014 and 2015 (% over the corresponding month of the previous year) |
Data source: Central Statistical Bureau of Latvia
Compared to January 2014, the greatest pressure on the average price level in January 2015 was put by drop in prices of transport goods and services, food and non-alcoholic beverages, as well as by rise in prices of goods and services related to housing, alcoholic beverages and tobacco, hotel and restaurant services.
The average price level of food in January 2015 as compared to the corresponding month of the previous year decreased by 2.6%. Vegetables had the most significant lowering impact on the price level. Drop was also observed in prices of meat and meat products, milk and dairy products, sugar, fruit, oils and fats. In turn, growth was recorded in prices of ground coffee, confectionery and honey, bread and cereals, as well as cheese.
Prices of tobacco rose by 9.3%. The average price level of alcoholic beverages decreased by 1.5%, which was affected by drop in prices of beer and wine. In turn, spirits became more expensive.
 |
| Commodity group impact on Consumer Price Index over the last 12 months (percentage points) |
Data source: Central Statistical Bureau of Latvia
During the year the average price level of goods and services related to housing increased by 5.8%, which was affected by liberalization of the electricity market. During the year growth was also recorded in prices of water supply, sewage collection, maintenance charges in multi-occupied buildings, services for maintenance and repair of the dwelling; in turn, prices of heat energy and gas witnessed a fall.
In transport group prices declined by 8.8%, which was significantly affected by drop of 19.2% in prices of fuels for transport. Decrease was also recorded in prices of spare parts and accessories for personal transport equipment.
Compared to January 2014, prices of hotel and restaurant services increased by 3.5%. Prices in cafés and restaurants rose by 3.7%, and in canteens - by 3.3%.
Among other commodity groups, the most significant decrease was recorded in prices of hospital services. In turn, the largest growth was observed in prices of cultural services, non-durable household goods.
Compared to the previous month, consumer prices in January 2015 grew by 0.1%. Prices of goods increased by 0.1%, while prices of services declined by 0.1%.
The greatest pressure on consumer price changes in January was put by growth in prices of goods and services related to housing, as well as by drop in prices of transport goods and services, clothing and footwear.
Prices of food declined by 0.2%, mainly due to sales campaigns for meat and meat products (-0.9%). Drop was also recorded in prices of milk and dairy products, bread and cereals. Growth was observed in prices of fruit (mainly of grapes and bananas), juices and soft drinks, ground coffee.
Affected by seasonal discounts and sales, prices of clothing dropped by 7.9%, and prices of footwear - by 4.5%.
Due to liberalization of the electricity market, electricity prices in January increased on average by 27.6%. Growth was recorded in prices of refuse collection, maintenance charges in multi-occupied buildings, sewage collection. Prices of heat energy and gas witnessed decline.
Price drop of 7.8% for fuels for transport had the most significant effect on price level in transport group. Passenger transport by sea and passenger transport by air became cheaper.
Among other commodity groups the most significant growth was recorded in prices of individual care goods, beer, non-durable household goods, and prices in cafés and restaurants. Affected by the reduction of patient fee for treatment in inpatient hospital, stipulated by Cabinet Regulations No 1529, prices of hospital services witnessed a drop.
As every year in January Consumer Price Index (CPI) basket was revised and updated. The weights used in the calculations of the index for 2015 represent household expenditure structure in 2014. CPI basket in 2015 contains 521 goods and services. Approximately two thousand various trade and services outlets are surveyed. In total, about 20 thousand prices are collected each month.
Consumer price changes by commodity group, %
|
Commodity group |
Price changes in January 2015 compared to: |
|
|
January 2014 |
December 2014 |
|
|
Total |
-0.4 |
0.1 |
|
Food |
-2.6 |
-0.2 |
|
Alcohol, tobacco |
2.2 |
0.5 |
|
Clothing, footwear |
-0.3 |
-6.7 |
|
Housing |
5.8 |
5.4 |
|
Furnishings |
1.9 |
0.8 |
|
Health |
0.3 |
-0.9 |
|
Transport |
-8.8 |
-3.6 |
|
Communication |
-0.4 |
0.0 |
|
Recreation, culture |
0.5 |
0.2 |
|
Education |
1.5 |
0.0 |
|
Hotels, restaurants |
3.5 |
0.5 |
|
Miscellaneous |
1.5 |
1.0 |
Sub-indices having the greatest impact, percentage points
|
During the month |
|
|
Electricity |
+0.88 |
|
Individual care goods |
+0.04 |
|
Beer |
+0.03 |
|
Non-durable household goods |
+0.03 |
|
Hospital services |
-0.06 |
|
Footwear |
-0.07 |
|
Clothing |
-0.30 |
|
Fuels for transport |
-0.46 |
|
During 12 months |
|
|
Electricity |
+0.88 |
|
Tobacco |
+0.25 |
|
Ground coffee |
+0.10 |
|
Heat energy |
-0.07 |
|
Milk and dairy products |
-0.15 |
|
Meat and meat products |
-0.19 |
|
Vegetables |
-0.41 |
|
Fuels for transport |
-1.21 |
Information on Consumer Price Index in February 2015 will be published on March 9.
More detailed information on consumer price changes is available in the CSB database section Consumer prices.
1 The annual measure of inflation. The annual measure of
inflation that is used to compare the average monthly price level with the
average price level in the corresponding month of the previous year.
2 The average annual measure of inflation that is used to compare
the average price level of the last 12 months with the average price level in
12 months of the previous year.


 «The Baltic Course» Is Sold and Stays in Business!
