
Analytics, Baltic Export, Baltic States – CIS, EU – Baltic States, Foreign trade , Latvia
International Internet Magazine. Baltic States news & analytics
Friday, 19.04.2024, 17:21
Foreign trade balance worsened due to export decline in Latvia in December
 Print version
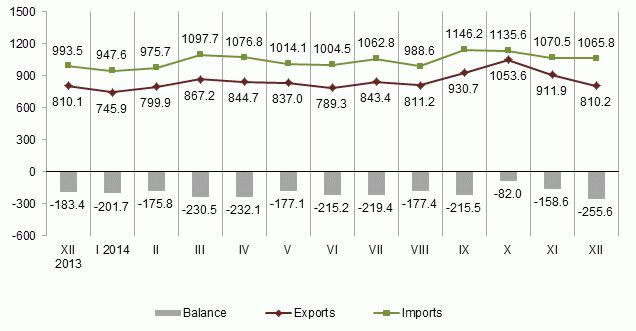 |
| Latvia’s foreign trade, mln euros (1) |
Main changes in exports in December, compared to November:
· exports of mineral products dropped by 29.1 mln euros or 33.5%,
· exports of basic metals and articles of basic metals fell by 19.3 mln euros or 25.9%,
· exports of wood and articles of wood reduced by 19.0 mln euros or 12.7%,
· exports of vegetable products decreased by 17.1 mln euros or 29.3%,
· exports of prepared foodstuffs dropped by 10.9 mln euros or 10.2%,
· exports of machinery and mechanical appliances; electrical equipment grew by 11.3 mln euros or 7.9%.
Main changes in imports in December, compared to November:
· imports of mineral products dropped by 24.4 mln euros or 13.3%,
· imports of prepared foodstuffs reduced by 5.6 mln euros or 6.3%,
· imports of optical instruments and apparatus (including medical); clocks and watches, musical instruments decreased by 4.9 mln euros or 18.1%,
· imports of textiles and textile articles declined by 4.5 mln euros or 10.0%.
Despite that imports value in main commodity groups reduced, imports of vehicles and associated transport equipment in December 2014, compared to November, increased by 38.9 mln euros or 75.9%. It was affected by increase in arrivals of passenger cars from Germany by 17.4 mln euros and of transport vehicles for transportation of 10 and more persons from Czech Republic by 11.4 mln euros.
Foreign trade of Latvia by country group in December 2014, at current prices
|
|
Exports |
Imports |
||||
|
|
mln euros |
% of total |
In % (+, –) over November 2014 |
mln euros |
% of total |
In % (+, –) over November 2014 |
|
Total |
810.2 |
100 |
-11.2 |
1,065.8 |
100 |
-0.4 |
|
Member States of the European Union |
575.4 |
71.0 |
-13.6 |
827.9 |
77.7 |
-3.1 |
|
Euro area countries |
223.1 |
27.5 |
-20.9 |
419.9 |
39.4 |
-1.3 |
|
CIS countries |
134.3 |
16.6 |
-7.6 |
145.3 |
13.6 |
+22.7 |
|
Other countries |
100.5 |
12.4 |
-0.1 |
92.6 |
8.7 |
-5.2 |
In December main export partners were Lithuania (20.2% of total export), Estonia (12.0%), Poland (6.2%) and Sweden (6.0%); main import partners were Lithuania (17.5% of total import), Poland (10.5%), Germany (9.9%) and Estonia (8.1%).
The main impact in trade with third countries was Russia, share of which in total Latvian exports in December accounted for 11.3%, but in imports – 9.9%.
Changes of main commodities in Latvia’s exports in December 2014, at current prices
|
|
thsd euros |
% of total |
% (+, –) over |
||
|
December 2013 |
November 2014 |
average of previous 12 months |
|||
|
Total |
810,236 |
100 |
+0.02 |
-11.2 |
-5.1 |
|
wood and wood products; wood charcoal |
130,319 |
16.1 |
+6.8 |
-12.7 |
-9.5 |
|
electrical machinery and equipment |
105,646 |
13.0 |
+23.7 |
+5.2 |
+11.9 |
|
beverages, spirits and vinegar |
59,366 |
7.3 |
+8.8 |
-10.9 |
+35.5 |
|
mineral fuels, mineral oils and products of their distillation |
54,302 |
6.7 |
+9.2 |
-33.3 |
-18.3 |
|
machinery and mechanical appliances |
48,311 |
6.0 |
+10.2 |
+14.4 |
+11.8 |
|
vehicles other than railway or tramway |
30,008 |
3.7 |
+26.3 |
+8.0 |
-12.4 |
|
pharmaceutical products |
25,917 |
3.2 |
-19.6 |
-5.9 |
-2.3 |
|
articles of iron and steel |
25,065 |
3.1 |
+14.8 |
-15.8 |
-12.6 |
|
furniture and other furnishings |
20,141 |
2.5 |
+14.6 |
-12.3 |
-3.5 |
|
plastics and articles thereof |
18,017 |
2.2 |
+1.4 |
-17.1 |
-10.3 |
Rise of exports of vehicles other than railway or tramway rolling stock, and parts and accessories thereof in December 2014, as compared to December 2013, was affected by the increase in exports of passenger cars to Lithuania by 4.3 mln euros and to Estonia – by 3.7 mln euros. In turn, exports of pharmaceutical products dropped as exports of medicaments pre-packed for retail sale decreased by 6.2 mln euros or 21.4%.
Changes of main commodities in Latvia’s imports in December 2014, at current prices
|
|
thsd euros |
% of total |
% (+, –) over |
||
|
December 2013 |
November 2014 |
average of previous 12 months |
|||
|
Total |
1,065,821 |
100 |
+7.3 |
-0.4 |
+2.2 |
|
mineral fuels, mineral oils and products of their distillation |
154,857 |
14.5 |
+0.2 |
-12.5 |
+3.4 |
|
electrical machinery and equipment |
132,431 |
12.4 |
+40.4 |
-5.2 |
+18.2 |
|
machinery and mechanical appliances |
100,371 |
9.4 |
-2.4 |
+12.2 |
+10.4 |
|
vehicles other than railway or tramway |
85,671 |
8.0 |
+22.5 |
+79.4 |
+28.4 |
|
pharmaceutical products |
45,546 |
4.3 |
+8.2 |
+2.9 |
+10.1 |
|
plastics and articles thereof |
40,938 |
3.8 |
+22.2 |
-1.5 |
-3.9 |
|
wood and wood products; wood charcoal |
27,822 |
2.6 |
+52.7 |
-9.1 |
+3.0 |
|
iron and steel |
27,767 |
2.6 |
-3.3 |
-1.9 |
-27.9 |
Rise of imports of wood and wood products; wood charcoal in December 2014, as compared to December 2013, was mostly affected by increase of 3.8 mln euros in imports of wood in the rough. In turn, decline in imports of iron and steel by 1.9 mln euros or by 66.8% influenced drop in imports of ferro alloy.
More information on Latvia’s foreign trade by month and quarter, by country group and commodity group is available in the CSB data base section "Foreign trade" Short term statistical data.
1 Data on March, April and September 2014 have been revised.


 «The Baltic Course» Is Sold and Stays in Business!
