
Analytics, Economics, GDP, Lithuania, Markets and Companies
International Internet Magazine. Baltic States news & analytics
Friday, 19.04.2024, 09:00
In 2014, GDP in Lithuania grew by 2.9%
 Print version
In IV quarter 2014, GDP amounted to EUR 9 242.6 million (LTL 31 912.9 million) at current prices; compared to IV quarter 2013, the real GDP change, seasonally and working day adjusted, stood at 2.4%, while compared to III quarter 2014 – grew by 0.6%.
Compared to the growth observed in the first three quarters of 2014, the GDP growth rate observed in the fourth quarter was slower, which was due to poorer performance results of wholesale and retail trade, repair of motor vehicles and motorcycles, transportation and storage, accommodation and food service enterprises. The growth in GDP was mainly conditioned by construction and industry.
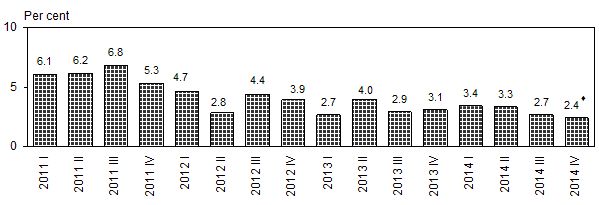 |
| Fig. 1. Changes in gross domestic product, compared to the same period of the previous year, seasonally and working days adjusted |
♦ GDP change first estimate.
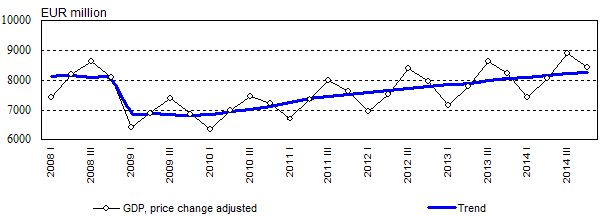 |
| Fig. 2. Changes in gross domestic product |
Statistics Lithuania, on the basis of more comprehensive data and estimation of the value added in accordance with a more detailed list of economic activities, has revised the III quarter 2014 GDP estimate. According to the revised data, in III quarter 2014, GDP amounted to EUR 9 729.4 million (LTL 33 593.5 million) at current prices. Against the same quarter of 2013, real GDP change, seasonally and working day adjusted, stood at 2.7% (the previously published III quarter real GDP change stood at 2.6%).
Gross domestic product and its changes
|
|
At current prices |
GDP changes, % |
|||
|
EUR million |
against |
against |
seasonally and working |
||
|
against |
against |
||||
|
2010 |
28 001.3 |
1.6 |
1.6 |
1.7 |
1.7 |
|
I |
6 281.0 |
–7.8 |
–1.0 |
0.9 |
–1.1 |
|
II |
7 155.9 |
10.5 |
1.2 |
1.6 |
1.6 |
|
III |
7 327.3 |
6.7 |
0.9 |
0.0 |
1.0 |
|
IV |
7 277.0 |
–3.2 |
5.1 |
2.5 |
5.1 |
|
2011 |
31 247.3 |
6.1 |
6.1 |
6.1 |
6.1 |
|
I |
6 905.0 |
–7.1 |
6.0 |
1.9 |
6.1 |
|
II |
7 970.4 |
10.0 |
5.5 |
1.7 |
6.2 |
|
III |
8 340.1 |
8.3 |
7.1 |
0.6 |
6.8 |
|
IV |
8 031.8 |
–4.5 |
5.7 |
1.1 |
5.3 |
|
2012 |
33 314.0 |
3.8 |
3.8 |
3.9 |
3.9 |
|
I |
7 480.5 |
–8.7 |
3.9 |
1.3 |
4.7 |
|
II |
8 316.9 |
8.0 |
2.0 |
–0.2 |
2.8 |
|
III |
8 942.2 |
11.7 |
5.1 |
2.1 |
4.4 |
|
IV |
8 574.4 |
–5.2 |
4.3 |
0.6 |
3.9 |
|
2013◘ |
34 955.6 |
3.3 |
3.3 |
3.2 |
3.2 |
|
I |
7 748.6 |
–9.8 |
3.1 |
0.1 |
2.7 |
|
II |
8 845.3 |
8.7 |
3.7 |
1.1 |
4.0 |
|
III |
9 360.5 |
10.8 |
3.0 |
1.1 |
2.9 |
|
IV |
9 001.2 |
–4.9 |
3.3 |
0.8 |
3.1 |
|
2014* |
36 270.8 |
2.9 |
2.9 |
2.9 |
2.9 |
|
I* |
8 124.3 |
–9.8 |
3.3 |
0.5 |
3.4 |
|
II* |
9 174.6 |
8.8 |
3.4 |
0.9 |
3.3 |
|
III* IV♦ |
9 729.4 9 242.6 |
10.1 -5.2 |
2.7 2.4 |
0.4 0.6 |
2.7 2.4 |
♦ First estimate. * Provisional
data. ◘ Non-final data.
------------------------
1GDP changes were seasonally and
working day adjusted.
Real GDP changes have been estimated using a chain-linking method, which
enables the elimination of the influence of price changes.
To ensure comparability across countries, Eurostat publishes GDP changes seasonally and working day adjusted.
For more information, see the Database of Indicators.


 «The Baltic Course» Is Sold and Stays in Business!
