
Agriculture, Analytics, Latvia, Markets and Companies
International Internet Magazine. Baltic States news & analytics
Saturday, 20.04.2024, 07:07
Medium-sized and large agricultural holdings manage 63.6% agricultural area in Latvia
 Print version
Compared to 2010 the total number of holdings in 2013 had decreased by 1.9%, while the utilised AA had grown by 4.5%. In turn, the number of small agricultural holdings compared to 2010 had decreased by 3.8% and their managed utilised AA – by 12.6%.
Number of agricultural holdings and utilised AA by size of holding (1)
|
|
Number of holdings, thsd |
Utilised AA, thsd ha |
||||||
|
|
2010 |
Share |
2013 |
Share |
2010 |
Share |
2013 |
Share |
|
All holdings, of which: |
83.4 |
100% |
81.8 |
100% |
1796.3 |
100% |
1877.7 |
100% |
|
small |
76.5 |
91.7% |
73.6 |
90.0% |
781.4 |
43.5% |
683.0 |
36.4% |
|
medium-sized |
5.8 |
7.0% |
6.8 |
8.3% |
439.4 |
24.5% |
471.4 |
25.1% |
|
large |
1.1 |
1.3% |
1.4 |
1.7% |
575.4 |
33.2% |
723.3 |
38.5% |
The average size of agricultural holdings had grown from 34.5 ha in 2010 to 37.4 ha in 2013, or by 8.4%. Compared to 2010 the utilised AA on average per holding increased by 1.5 ha or 12.0%. The average number of livestock per agricultural holding also increased in 2013. One livestock-breeding agricultural holding was breeding 14 cattle (of which 7 dairy cows), 29 pigs, 25 sheep, 6 goats and 231 poultry.
Average indicators characterising agricultural holdings
|
|
All holdings |
Small |
Medium-sized |
Large |
||||
|
|
2010 |
2013 |
2010 |
2013 |
2010 |
2013 |
2010 |
2013 |
|
Total area, ha |
34.5 |
37.4 |
21.2 |
21.5 |
100.6 |
92.7 |
630.9 |
589.2 |
|
AA, ha |
23.2 |
24.9 |
11.8 |
11.1 |
77.2 |
95.0 |
542.3 |
507.7 |
|
Utilised AA, ha |
21.5 |
23.0 |
10.2 |
9.3 |
75.5 |
69.8 |
536.3 |
502.6 |
|
Arable land, ha |
13.4 |
14.7 |
3.4 |
3.0 |
55.8 |
48.2 |
500.0 |
455.6 |
|
Sown area, ha |
12.5 |
14.0 |
3.1 |
2.8 |
52.0 |
45.4 |
471.8 |
436.0 |
|
Utilised meadows, ha |
5.9 |
7.0 |
4.7 |
5.1 |
17.5 |
20.2 |
30.6 |
42.0 |
|
Number of cattle2 |
11.2 |
14.3 |
4.2 |
4.3 |
34.4 |
32.5 |
228.2 |
215.4 |
|
Regular labour force |
2.2 |
2.1 |
2.0 |
1.9 |
3.0 |
2.7 |
11.8 |
9.8 |
Compared to 2010, in 2013 the number of the agricultural holdings specialising in dairying had increased by 26.6% (in 2013 – 13.0 thsd), specialising in crop and livestock production – by 9.7% (in 2013 – 12.4 thsd), and in field crops – by 7.0% (in 2013 – 38.0 thsd).
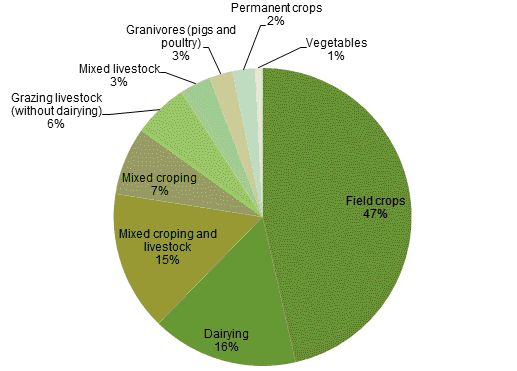 |
| Agricultural holdings by type of farming in 2013 (of total number of holdings) |
Data source: Central Statistical Bureau of Latvia
In 2013, 43.9% of all holdings produced agricultural products for sale, which is 0.4% more than in 2010. Only 3.3% of holdings sold all of their produced agricultural products (compared to 2013 – an increase of 1.1%), and 9.5% of holdings sold up to 25% of the produced agricultural products (in 2010 – 11.5%).
In 2013, 80.4 thsd holdings or 98.4% of the total number of agricultural holdings were owned by one natural person, of which 36.8 thsd or 45.7% were women. 1.2 thsd or 1.5% of agricultural holdings were joint-property holdings.
The educational level of managers of agricultural holdings has grown. If in 2010 only 5.9% of managers had higher agricultural education, in 2013 this number accounted for 6.7%. The share of managers with only practical experience in agricultural works has declined from 61.5% in 2010 to 58.4% in 2013.
More detailed results of Farm Structure Survey 2013 will be available in the CSB database on 30.12.2014.
Explanations
1 In the European Union (EU) agricultural holdings are broken down into economic size groups: small holdings – holdings with standard output (SO) up to EUR 14.9 thsd, medium-sized holdings – SO from EUR 15.0 – EUR 99.9 thsd, and large holdings – SO over EUR 100 thsd.
Standard output –an indicator characterising the economic activity of an agricultural holding, i.e., value acquired from one hectare of agricultural crops or livestock head (unit), estimated at prices of the corresponding region and expressed in EUR. Total standard output characterises the economic size of a holding in monetary terms. To determine the economic size of a holding, the CSB uses the standard output per one hectare of agricultural crops and one livestock unit set by the State Institute of Agrarian Economics.
2 In cattle-breeding holdings.


 «The Baltic Course» Is Sold and Stays in Business!
