
Analytics, Economics, Estonia, GDP, Markets and Companies
International Internet Magazine. Baltic States news & analytics
Thursday, 25.04.2024, 19:16
More than a half GDP of Estonia is created in Harju county
 Print version
In 2013, the GDP of Estonia at current prices was 18.7 billion euros, of which the share of Harju county was 11.5 billion euros and that of Tallinn 9.3 billion Euros. Harju county was followed by Tartu and Ida-Viru counties, the shares of which in the GDP of Estonia were 10% and 7.6%, respectively.
Harju, Tartu and Ida-Viru counties gave a total of 84% of the value added in services and almost three-quarters of the value added in industry and construction.
The counties which contributed the least to the total GDP of Estonia were Hiiu, Lääne and Põlva. The total share of these counties in the GDP of Estonia accounted for 2.5%.
In 2013, 67% of the total value added of Estonia was created in services, 29% in industry and construction and 4% in agriculture, forestry and fishing.
The service sector was the biggest sector in all counties besides Ida-Viru county. The share of services was the largest in Harju (75%) and Tartu (69%) counties, mainly due to the high input of the cities of Tallinn and Tartu.
The share of agriculture, forestry and fishing was the biggest in Jõgeva county (22%). The share of industry and construction was the largest in Ida-Viru county (53%), which shows the important role of mining and energy in this county’s economic activity.
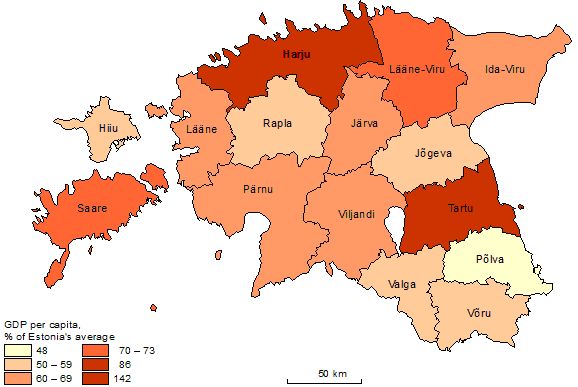 |
| GDP per capita, 2013 |
In 2013, Estonia’s GDP per capita was 14,218 euros. Compared to 2012, this indicator has risen by 884 euros. In 2013, the GDP per capita was the highest in Harju county, exceeding Estonia’s average by 42%. Harju county was followed by Tartu and Lääne-Viru counties, where the GDP per capita was 86% and 73% of the Estonian average, respectively. The indicator was the lowest in Põlva county, where the GDP per capita was less than a half of the Estonian average.
Statistics Estonia revised the regional accounts time series for 2000–2012 according to the new European System of National and Regional Accounts (ESA 2010). The main change for the regional GDP was the calculation of local kind-of-activity units.
For additional information about the revision of the GDP time series published on 8 September is available HERE.
Impact of the time series revision by region, 2009–2012 (percentages)
|
Aasta |
Põhja-Eesti |
Lääne-Eesti |
Kirde-Eesti |
Kesk-Eesti |
Lõuna-Eesti |
Kokku |
|
2009 |
1,1 |
4,1 |
2,2 |
1,7 |
-0,2 |
1,2 |
|
2010 |
2,2 |
5,6 |
2,2 |
0,9 |
2,1 |
2,4 |
|
2011 |
1,0 |
0,6 |
1,9 |
1,9 |
1,2 |
1,2 |
|
2012 |
2,6 |
-1,0 |
-6,6 |
2,0 |
1,0 |
1,3 |
Industry and construction – mining and quarrying; manufacturing; electricity, gas, steam and air conditioning supply; water supply; sewerage, waste management and remediation activities; construction.
Services – wholesale and retail trade; repair of motor vehicles and motorcycles; transportation and storage; accommodation and food service activities; information and communication; financial and insurance activities; real estate activities; professional, scientific and technical activities; administrative and support service activities; public administration and defence; compulsory social security; education; human health and social work activities; arts, entertainment and recreation; other service activities.


 «The Baltic Course» Is Sold and Stays in Business!
